Weekly Market Commentary | November 25th, 2024

Weekly Market Commentary | November 25th, 2024

Week in Review…

Markets rallied last week as investors digested positive economic data and election results. The major indices all reached new record highs:

  • The S&P 500 rose +1.68%
  • The Dow Jones Industrial Average was up +1.96%
  • The tech-heavy Nasdaq finished up +1.73%
  • The 10-Year Treasury yield ended the week at 4.412%

A Quiet Week Ahead of the Holidays

Last week was relatively quiet as the market geared up for the holiday season. Despite the slower pace, several key reports provided important insights into the economy.

Mixed Signals in the Housing Market

The housing market presented a mixed picture. While existing home sales exceeded expectations, rising month-over-month (MoM) by 3.4%, new home construction showed signs of weakness. Building permits and housing starts underperformed, with the latter declining by 3.1% MoM. This suggests that while buyers are willing to purchase available homes, builders may be hesitant to start new projects due to rising long-term interest rates.

Consumer Sentiment Remains Cautious

The University of Michigan’s consumer sentiment index and inflation expectations surveys offered further insights into consumer attitudes. While consumers’ inflation expectations align with consensus forecasts, their overall sentiment remains cautious. Both consumer sentiment and inflation expectations came in lower than expected, indicating continued uncertainty about the economy’s trajectory.

Spotlight

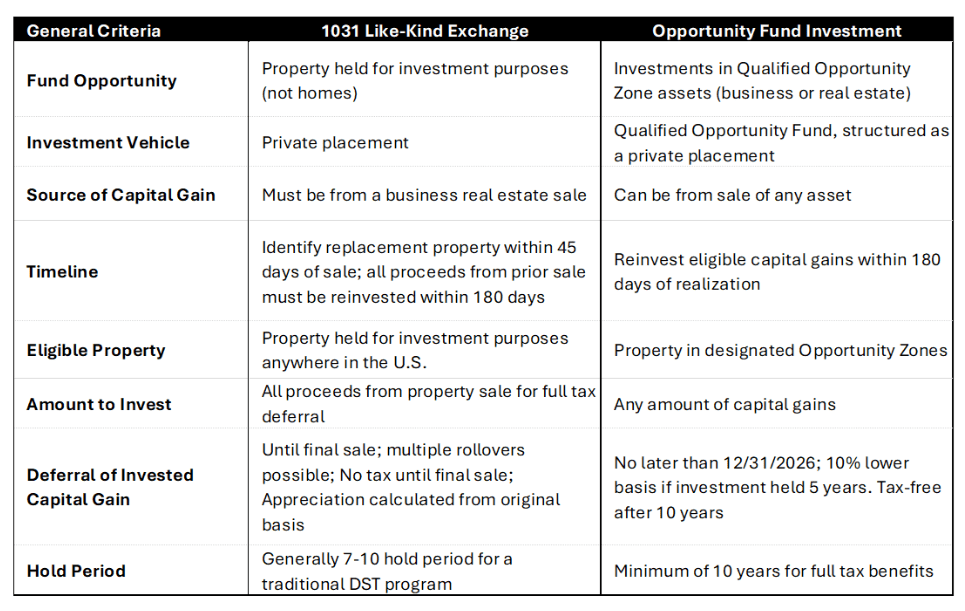
Tax Strategies Unveiled: Understanding 1031 Exchanges Versus Qualified Opportunity Zones

For decades, investors have utilized Internal Revenue Code (IRC) Section 1031 to defer capital gains on investment property sales through like-kind exchanges. The Qualified Opportunity Zone (QOZ) program, established by the Tax Cuts and Jobs Act of 2017, offers an alternative method to postpone and potentially eliminate certain taxable gains. This spotlight examines key characteristics and investment considerations for these two programs without delving into their mechanics.

1031 Exchanges

The 1031 exchange, named after its section in the Internal Revenue Code, involves selling and buying similar types of investment properties of equal or greater value. If the exchanged property involves leverage, the replacement property must have equal or greater leverage to avoid triggering taxable events. Key aspects of 1031 exchanges include:

  • A 45-day identification period for the new asset after the original asset’s sale
  • A 180-day acquisition period for the replacement property
  • Potential combination with other tax benefits, such as depreciation. When exchanging properties, the cost basis of the new property is reduced by previously claimed depreciation on the original property, allowing continued depreciation claims on the new property.
  • Indefinite tax deferral through repeated exchanges, unless a 721-tax deferral option is used to UPREIT the DST interests into a REIT

IRC Section 1031 does not permit exchanges for primary residences. Instead, IRC Section 121 addresses the homebuyer exclusion limits.

Qualified Opportunity Zone Funds

Qualified Opportunity Zone (QOZ) Funds offer tax benefits for investors with capital gains, including:

  • Capital gains tax deferral
  • Potential reduction of the original deferred gain (if the investment is held for at least five years)
  • Tax-free appreciation on the QOZ Fund investment if held for at least 10 years

Unlike 1031 exchanges, only the gain needs to be invested in a QOZ Fund within 180 days of sale to defer taxes, and the investment can be from any appreciated asset. QOZ Funds must adhere to specific guidelines, including:

  • Investing only in QOZ-specific census tracts designated by the U.S. Treasury
  • Holding at least 90% of assets in QOZ property
  • Deriving at least 50% of gross income from active conduct of business in the QOZ
  • Using a substantial portion of intangible property in active business conduct in the QOZ
  • Having less than 5% of assets in nonqualified financial property

Deferred gains invested in QOZ Funds become taxable on December 31, 2026, or when the investment is sold, whichever comes first. Investors who hold their QOZ Fund investment for at least five years can permanently reduce their tax liability on the original deferred gain by 10%.

Comparing the Two

The key difference between 1031 exchange and QOZ programs lies in their tax deferral structures. Non-721 (pure) 1031 exchanges offer unlimited tax deferral, while QOZs have a limited deferral period but provide tax-free profits after a 10-year hold.

For those aiming to defer taxes indefinitely without accessing investment capital, non-721 1031 exchanges are preferable. They can be valuable estate planning tools, as heirs receive a stepped-up basis to the property’s fair market value at death, erasing previous appreciation.

QOZs are better for investors planning to realize profits within their lifetime. However, taxes on the original investment are due on December 31, 2026, regardless of circumstances.

Risks

Both 1031 exchanges and Qualified Opportunity Zones (QOZs) carry significant risks.

For 1031 exchanges, these include strict timelines, adherence to the ‘seven deadly sins,’ potential overpayment for replacement properties, and market volatility. QOZs face risks such as regulatory changes, economic uncertainties in designated zones, and the requirement to pay deferred taxes by December 31, 2026.

Both strategies involve illiquidity and the potential for investment losses that are inherent in any private real estate transaction, and sponsor/manager risk for syndicated private placement programs.

Optimal Choice

The optimal choice between these strategies hinges on each investor’s specific financial objectives and tax planning considerations. Depending on a client’s unique circumstances, both approaches can be effectively utilized, either independently or in combination, to maximize overall financial benefits.

IMPORTANT DISCLOSURE

This content is presented for informational purposes and is not an exhaustive list of all considerations related to 1031 exchange and qualified opportunity zone investments.  The information presented was not prepared in connection with any specific offering or based on the individual needs of any one investor but rather for general educational purposes. This communication shall not constitute an offer to sell or the solicitation of an offer to buy securities. 1031 Exchange and Qualified Opportunity Zone investments are intended only for persons who are accredited investors. We make no representation or warranty of any kind with respect to the acceptance by the IRS or any state taxing authority of your treatment of any item on your tax return or the tax consequences.

There is no guarantee that any real estate strategy, including those described herein, will be successful. An investment in a real estate investment offering is speculative and involves significant risks including but not limited to: no secondary market for the securities; limited liquidity for the securities, limitations on the transfer and redemption of shares; distributions made may not come from income, could be subject to Board discretion, not guaranteed and can be deemed a return of capital – there can be no limits on the amounts paid from these other sources;  the investment may lack property diversification;  the Sponsor and Trustee are generally dependent upon the advisor to select investments and conduct operations; and the advisor will face conflicts of interest. Investments are not bank guaranteed, not FDIC insured and may lose value.

Week Ahead…

A Busy Week for Economic Data

Despite the Thanksgiving holiday shortening the week, several important economic reports are scheduled to be released. These reports will provide valuable insights into the current state of the U.S. economy and could influence market sentiment.

Treasury Auctions and Yield Curve

On Monday and Tuesday, the Treasury Department will auction off 2-year and 5-year Treasury notes. The 2-year note is particularly significant as it’s highly sensitive to interest rate policy decisions and reflects market expectations for short-term rates. The yield curve, often measured by the difference between the 10-year and 2-year yields, is a key indicator of economic health. An inverted yield curve, where the 2-year yield exceeds the 10-year yield, can signal an impending recession.

Consumer Strength and Housing Market

Tuesday will also bring data on new home sales and consumer confidence. New home sales will reveal how consumers have navigated rising mortgage rates in October, which started the month at 6.12% and ended at 6.72%. Consumer confidence is a crucial indicator as consumer spending accounts for approximately 68% of U.S. GDP in Q2 2024.

GDP and Inflation

On Wednesday, the Bureau of Economic Analysis will release the annualized quarter-over-quarter change in real gross domestic product (GDP), a measure of economic growth. Additionally, the Core Personal Consumption Expenditures (PCE) Price Index, a key inflation indicator, will be released. Current projections point to a 0.3% month-over-month increase and a 2.7% year-over-year increase.

This content was developed by Cambridge from sources believed to be reliable. This content is provided for informational purposes only and should not be construed or acted upon as individualized investment advice. It should not be considered a recommendation or solicitation. Information is subject to change. Any forward-looking statements are based on assumptions, may not materialize, and are subject to revision without notice. The information in this material is not intended as tax or legal advice.

Investing involves risk. Depending on the different types of investments there may be varying degrees of risk. Socially responsible investing does not guarantee any amount of success. Clients and prospective clients should be prepared to bear investment loss including loss of original principal. Indices mentioned are unmanaged and cannot be invested into directly. Past performance is not a guarantee of future results.

The Dow Jones Industrial Average (DJIA) is a price-weighted index composed of 30 widely traded blue-chip U.S. common stocks. The S&P 500 is a market-cap weighted index composed of the common stocks of 500 leading companies in leading industries of the U.S. economy. The NASDAQ Composite Index is a market-value weighted index of all common stocks listed on the NASDAQ stock exchange.


Market Commentary | November 18th, 2024

Market Commentary | November 18th, 2024

Week in Review…

Markets retreated last week as investors reassessed potential tariff implications as well as concerns around inflation reaccelerating.

  • The S&P 500 fell 2.08%, ending a multi-week positive streak
  • The Dow Jones Industrial Average was down 1.24%
  • The Nasdaq finished the weakest, down 3.15%
  • The 10-Year Treasury yield ended the week at 4.45%

This past week’s economic data centered around inflation with Consumer Price Index (CPI) data for October having been released. Core CPI remained unchanged at 0.3% month-over-month (MoM), in line with expectations. Headline CPI also held steady at 0.2% MoM and rose to 2.6% year-over-year (YoY). Investors paid close attention to these rates as concerns of possible reinflation have started to worry some market participants, which could limit the Fed’s rate cut regime. However, steady core CPI suggests underlying inflation pressures remain stable, providing some mild reassurance to investors.

Thursday, we received Producer Price Index (PPI) data which increased by 0.2% MoM, matching expectations. Crude oil inventories rose by 2.1 million barrels, reflecting ongoing market adjustments following geopolitical tensions. Additionally, Fed Chairman Powell spoke on Thursday, emphasizing that the economy is not signaling a need to rush interest rate cuts. Powell’s cautious stance on rate cuts indicates the Fed’s focus on sustaining economic stability amid mixed signals from inflation data.

Finally, we finished the week with retail sales numbers for October, which showed a 0.74% MoM increase and a 4.13% YoY rise. Core retail sales also saw a modest gain of 0.3% MoM. The robust retail sales figures suggest consumer spending remains resilient as we head into the holiday season, potentially boosting economic growth.

Spotlight

A Relook at the 60/40 Portfolio

The 60/40 was once the gold standard of portfolio allocation. Over the past few years, we have seen this standard challenged by rising inflation and dominance in U.S. equities. Why has this changed and what can be learned?

The Rise

The 60/40 portfolio is a portfolio that consists of a 60% equity allocation and a 40% bond allocation and has its roots stretching back to Harry Markowitz and modern portfolio theory. The crux of the theory rests on the idea that diversification is a desirable feature in constructing a portfolio. In the same way, the 60/40 rests on the idea of diversification of asset classes.

The 60/40 portfolio has become more than a theory, and over the past 70 to 80 years, essentially became the gold standard of investment allocation. Below is a chart for return, risk, and efficiency ratios from January 1, 1981 to October 31, 2024, for a hypothetical 60/40 portfolio (all numbers have been annualized):

Despite portfolio returns that lagged stock returns, the beauty of the portfolio was the efficient use of risk. The 60/40 portfolio was able to capture more excess return per unit of risk taken. This was made possible in part because the correlation between stocks and bonds remained negative throughout that period. Meaning, the combined risk of the portfolio was less than the sum of its parts.

What made the strategy even more impressive was its simplicity and how it was tailored to investor’s biases. The 60/40 neither requires active management nor access to exclusive funds. The strategy was simple, liquid, and built to suffer shallower drawdown (periods of loss) to prevent panic selling. The market had found a simple but powerful tool to help harness the benefits of diversification. However, no tool is suitable for every situation.

The Fall from Grace

2022 was more than simply a bad year; for the 60/40 portfolio, it was a bit of an identity crisis. Both U.S. equities and U.S. Treasuries suffered significant drawdowns. Bonds did not serve as a ballast for equity losses that year. As a result, the 60/40 portfolio suffered its worst performance since 1937, declining 17.5%, the fourth worst performance in the last 200 years.1 The portfolio was built on the principles of diversification and risk efficiency. Perhaps the 60/40 portfolio had outlived its utility?

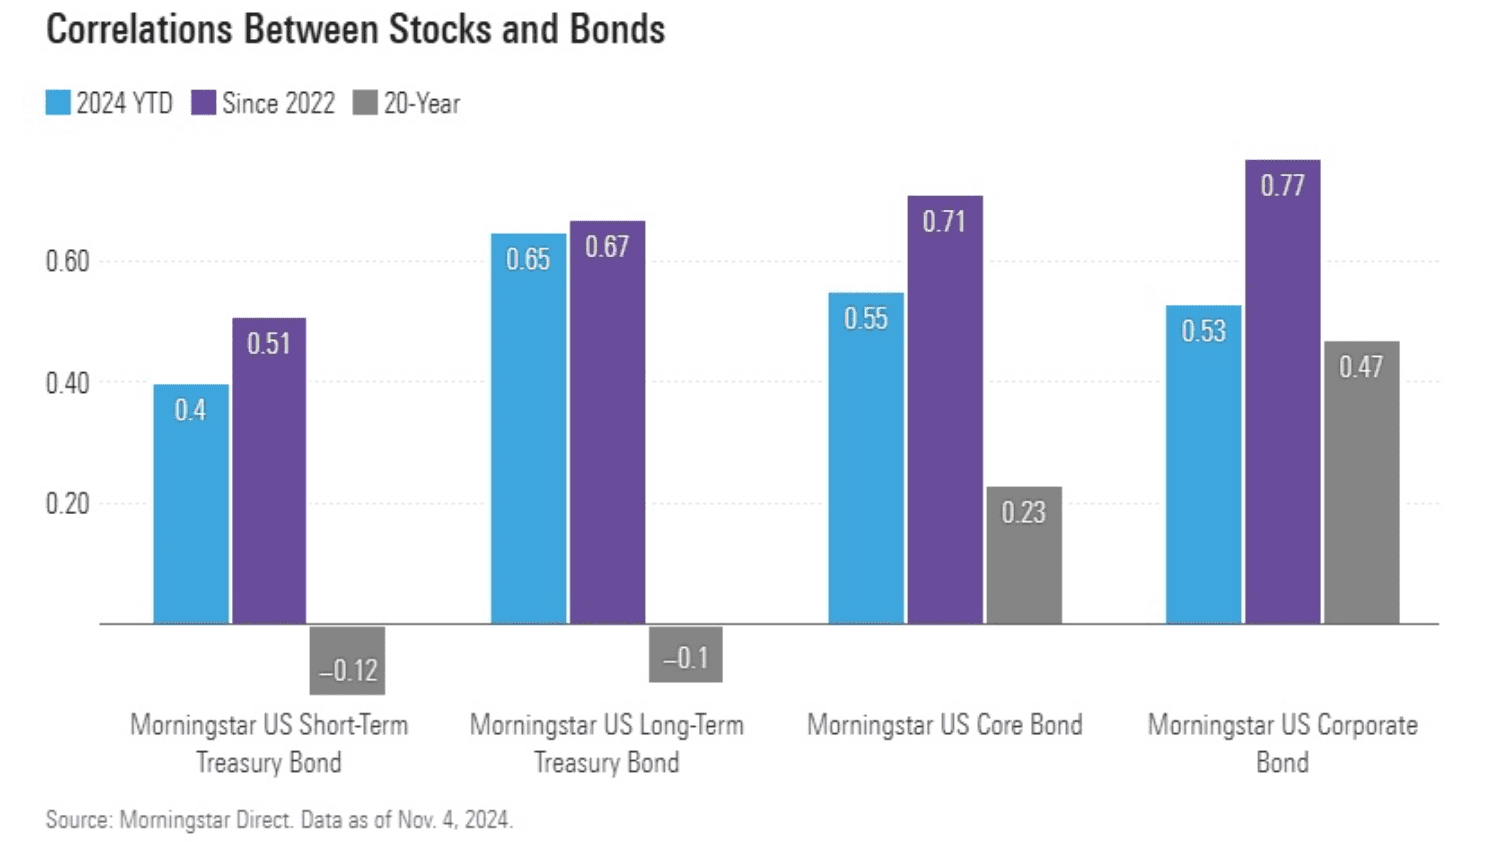
As it turns out, 2022 was a “perfect storm” of economic factors like highest inflation levels in 40 years and a Central Bank that raised interest rates 11 times to combat this inflation.2 In essence, the confluence of strong economic headwinds showed investors that the 60/40 is not bulletproof. The portfolio relies heavily on the correlation between stocks and bonds and correlations change over time. The graph below illustrates these changing correlations:

The academic term for the chart above is regime change, but this is basically a fancy term for “things don’t stay the same.” This statement is true for correlations as well. Correlations are not static. This can become problematic when portfolio allocations are built around a negative correlation between stocks and bonds that is no longer true. That is what happened in 2022. Investors are not terribly concerned about assets appreciating in unison, but they become concerned when assets begin falling together in unison. Both bonds and stocks lost money at the same time. Not surprisingly, investors began to question how viable the 60/40 portfolio would be going forward.

The Prodigal Son Returns?

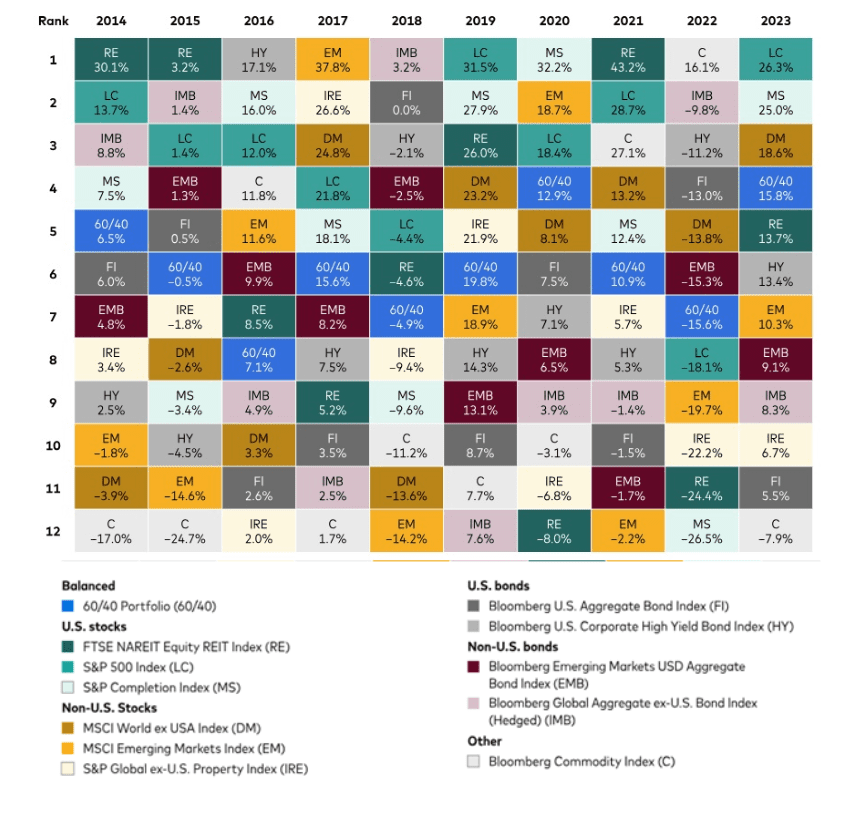
The strategy will remain relevant because it is built on a fundamental tenet of finance: diversification. In short, the 60/40 portfolio is not dead because diversification is not dead. The below graph provides a reference for how diversification is helpful in smoothing out the volatility of asset class returns. 

Recent history shows that the 60/40 portfolio can be very sensitive to the change in correlation between stocks and bonds. For example, the chart below shows how changes in the stock/bond correlation are influenced by different inflation regimes. Meaning, historical correlations may not be as stable as they appeared. Consequently, a 60/40 portfolio might not be your entire portfolio, but rather, a core position with supplemental assets to help reap further diversification benefits. In that sense, perhaps the 60/40 portfolio didn’t die, but expanded upon its core tenant of diversification. 

The 60/40 portfolio provides a wonderful example of how constructing a portfolio is less about how well assets perform individually, but rather, how assets and asset classes interact with each other. The next time you look to add or subtract a position to your portfolio consider how the current and proposed positions move in relation to the other assets. 

Week Ahead…

Next week is expected to be relatively quiet in terms of economic data releases. On Tuesday, the market will see new data on housing starts and building permits. Housing starts have shown some improvement, reaching a five-month high in the previous month, while building permits posted a slight increase. However, economists caution that residential investment will likely continue to weigh on gross domestic product (GDP) growth.

On Thursday, the weekly jobless claims report will be released, continuing to serve as a leading indicator for the labor market’s health. Recent disruptions from hurricanes and ongoing labor disputes led to a temporary rise in jobless claims last month, and these impacts will likely linger into next week’s report, potentially inflating the jobless numbers. While the figures may appear elevated due to these external factors, they’re unlikely to signal underlying weakness in the labor market. The temporary rise in unemployment claims from the recent disruptions isn’t expected to prompt faster rate cuts, as the broader labor market remains relatively resilient. Unless there are signs of sustained weakness, the Fed is likely to stay cautious in its approach, keeping a close eye on economic data over the coming months before making significant policy adjustments.

Additionally, next week will bring the latest consumer sentiment data from the University of Michigan. This sentiment index has shown steady improvement over the past four months, with last month’s reading sitting 50% above its level in June 2022. However, despite this upward trend, sentiment remains below pre-pandemic levels. Next week’s release will also be the first to capture sentiment following the recent election, providing insight into how the results may influence consumer confidence. It will be interesting to see whether the election outcomes further boost sentiment or if concerns over economic and policy uncertainties temper consumer outlooks.

1 Kandhari, Jitania. “Big Picture: Return of the 60/40. https://www.morganstanley.com/im/publication/insights/articles/article_bigpicturereturnofthe6040_ltr.pdf.

2 Thornburg Investment Management®. “Revisiting the 60-40 Portfolio.” Thornburg Investment Management, November 28, 2023. Accessed November 14, 2024. https://www.thornburg.com/article/revisiting-the-60-40-portfolio/.

3 Albrecht, Bella. “‘Diversification Is Back’—Why 60/40 Portfolios Are Working.” Morningstar, Inc., November 8, 2024. Accessed November 14, 2024. https://www.morningstar.com/markets/diversification-is-backwhy-6040-portfolios-are-working.

4 Vanguard. “The Global 60/40 Portfolio: Steady as It Goes,” October 22, 2024. Accessed November 14, 2024. https://corporate.vanguard.com/content/corporatesite/us/en/corp/articles/global-60-40-portfolio-steady-as-it-goes.html#:~:text=Fast%20forward%20to%20September%202024,return%20since%20year%2Dend%202022.&text
=Even%20accounting%20for%202022%2C%20the,above%20its%20long%2Dterm%20average.

5 Godbersen, Soren. “The 60/40 Portfolio: Why the Classic Model Faces Challenges, and How to Go Beyond.” EquityMultiple, November 10, 2024. Accessed November 15, 2024. https://equitymultiple.com/blog/60-40-portfolio.

This content was developed by Cambridge from sources believed to be reliable. This content is provided for informational purposes only and should not be construed or acted upon as individualized investment advice. It should not be considered a recommendation or solicitation. Information is subject to change. Any forward-looking statements are based on assumptions, may not materialize, and are subject to revision without notice. The information in this material is not intended as tax or legal advice.

Investing involves risk. Depending on the different types of investments there may be varying degrees of risk. Socially responsible investing does not guarantee any amount of success. Clients and prospective clients should be prepared to bear investment loss including loss of original principal. Indices mentioned are unmanaged and cannot be invested into directly. Past performance is not a guarantee of future results.

The Dow Jones Industrial Average (DJIA) is a price-weighted index composed of 30 widely traded blue-chip U.S. common stocks. The S&P 500 is a market-cap weighted index composed of the common stocks of 500 leading companies in leading industries of the U.S. economy. The NASDAQ Composite Index is a market-value weighted index of all common stocks listed on the NASDAQ stock exchange.
Market Commentary | November 11th, 2024

Market Commentary | November 11th, 2024

Week in Review…

Following the highly anticipated U.S. election and rate cut decision by the Fed, last week saw equity market’s rally after the election of Donald Trump as the 47th president of the United States.

  • The S&P 500 rose 4.66%, snapping a two-week negative streak
  • The Dow Jones Industrial Average was up 4.61%
  • The Nasdaq finished the strongest, up 5.74%
  • The 10-Year Treasury yield ended the week at 4.34%

Last week saw U.S. elections take center stage as Donald Trump was reelected, winning both the electoral vote and popular vote. Additionally, Republicans won a majority in the Senate while the House is still up in the air as 19 races are still too close to call. Markets rallied in futures on early Wednesday morning, leading to a strong rally that persisted through the end of the week. In this week’s spotlight, we analyze some of the market’s reaction to Trump’s victory.

Additionally, the Federal Reserve cut its benchmark interest rate by 0.25 percentage points, bringing it to a target range of 4.50%-4.75%. This marks the second consecutive rate cut, aimed at supporting employment and addressing cooling inflation. The decision reflects the Fed’s ongoing efforts to recalibrate monetary policy to better align with current economic conditions.

Finally, the U.S. Department of Labor reported that initial unemployment claims rose slightly to 221,000 for the week ending November 2, 2024, up by 3,000 from the previous week’s revised level. This increase in claims suggests a modest uptick in layoffs, though overall levels remain historically low. The four-week moving average, which smooths out weekly volatility, decreased by 9,750 to 227,250, indicating a generally stable labor market.

Spotlight

How The Market Reacted Following the Election Results

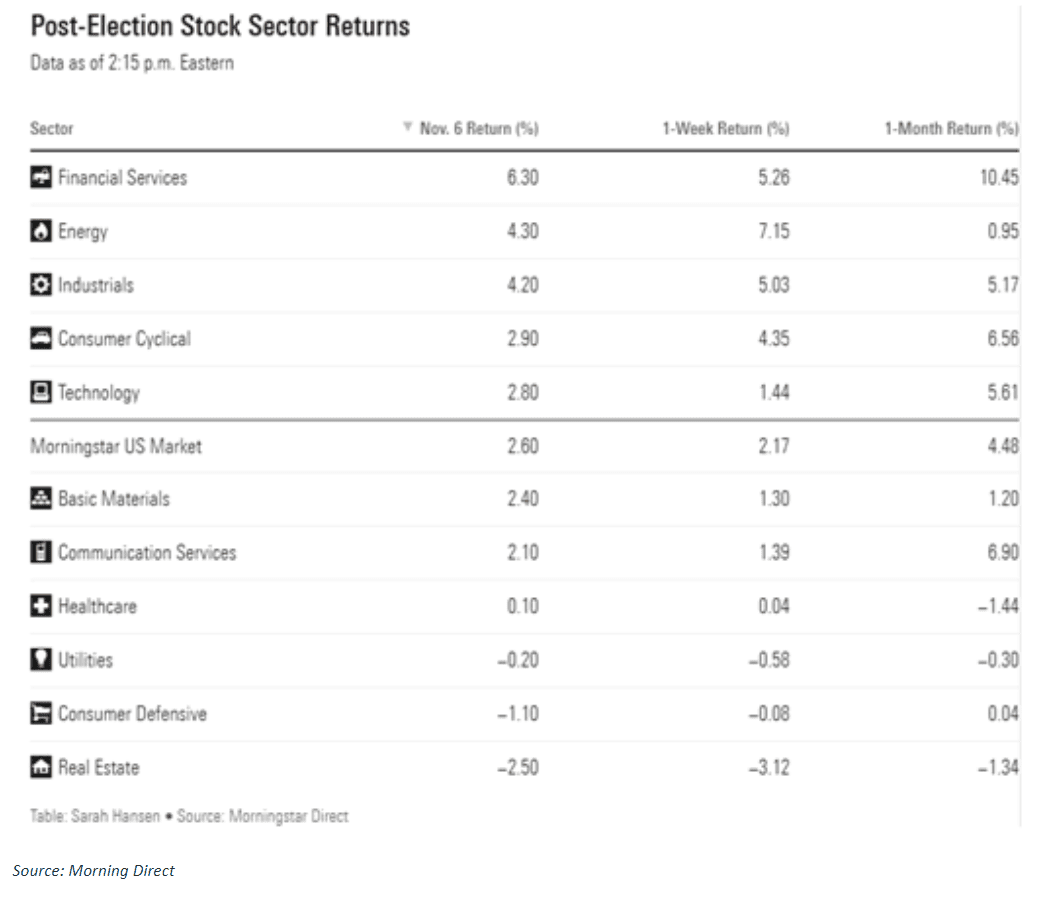
The 2024 election was one of the closest elections in recent history, with no clear frontrunner emerging polls prior to Election Day. Uncertainty about the outcome led the market to not price in a decisive scenario for either candidate. Following the election outcome, markets reacted swiftly and positively, particularly in sectors expected to benefit from the new administration’s policies.

Equity Markets

U.S. Equity Markets’ capitalization rose by $1.62 trillion the following day, the fifth-best one-day return ever. The S&P 500 rose by 2.5%, reaching an all-time high. Small cap stocks saw the largest growth, with the Russell 2000 also hitting an all-time high and rising by 5.8%. This small-cap surge is largely attributed to the perception that tariffs will protect smaller companies with primarily domestic operations.

Enthusiasm was especially pronounced in the financial services and energy sectors, which returned 6.3% and 4.3%, respectively. Investors anticipate eased regulatory pressure on banks and increased dealmaking among smaller and midsize financial institutions under a Trump administration. Bank stocks were also said to be expected to benefit from a steeper yield curve and higher long-term interest rates. The energy sector gained from expectations of fewer environmental regulations, while clean energy stocks plummeted.


Fixed Income Markets

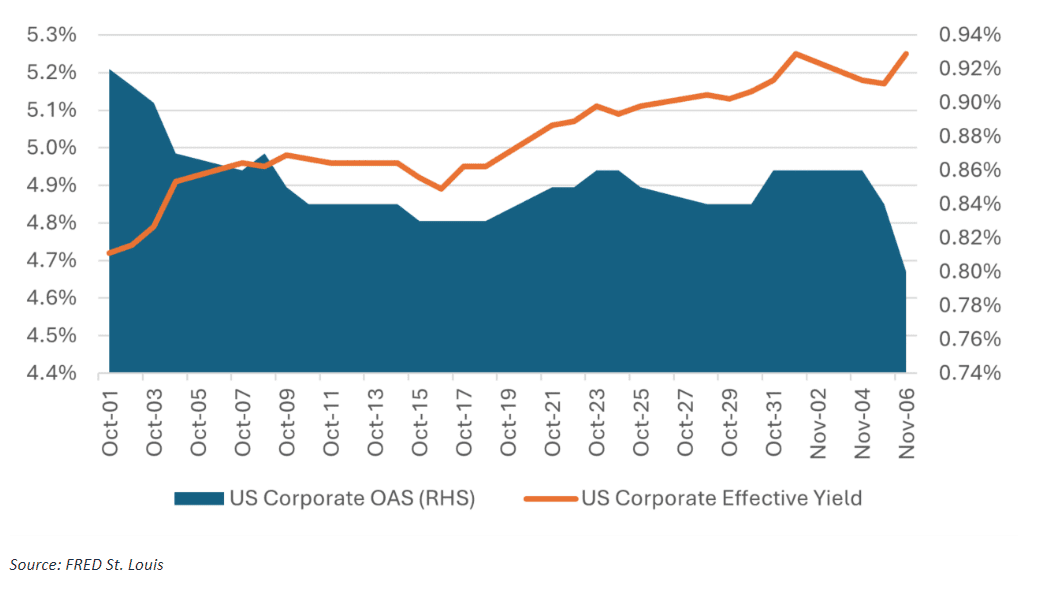
U.S. government bond yields increased due to anticipated fiscal expansion, larger deficits, and inflationary pressures. Trump’s victory had minimal impact on market expectations regarding the Federal Reserve’s cutting cycle, with projected rate cuts for 2024 and 2025 remaining unchanged. Credit spreads tightened, indicating a risk-on sentiment in the markets following the election.

Credit Spreads Tightened and Yield Rose for U.S. Corporate Bond

U.S. Dollar and Cryptocurrency

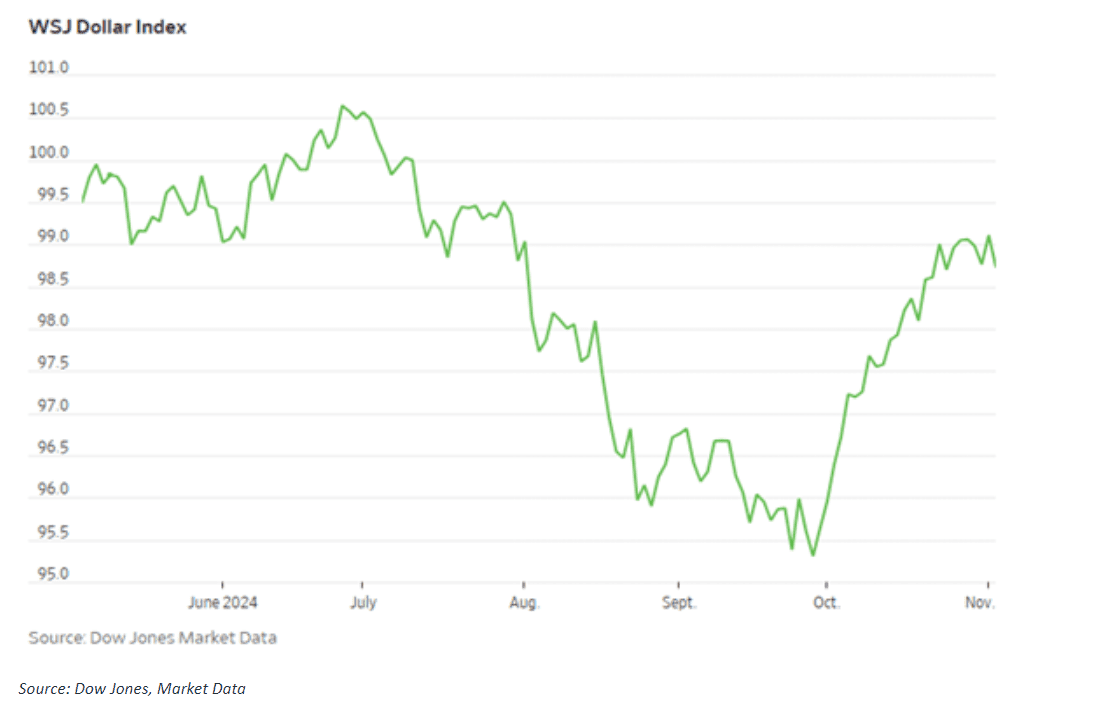
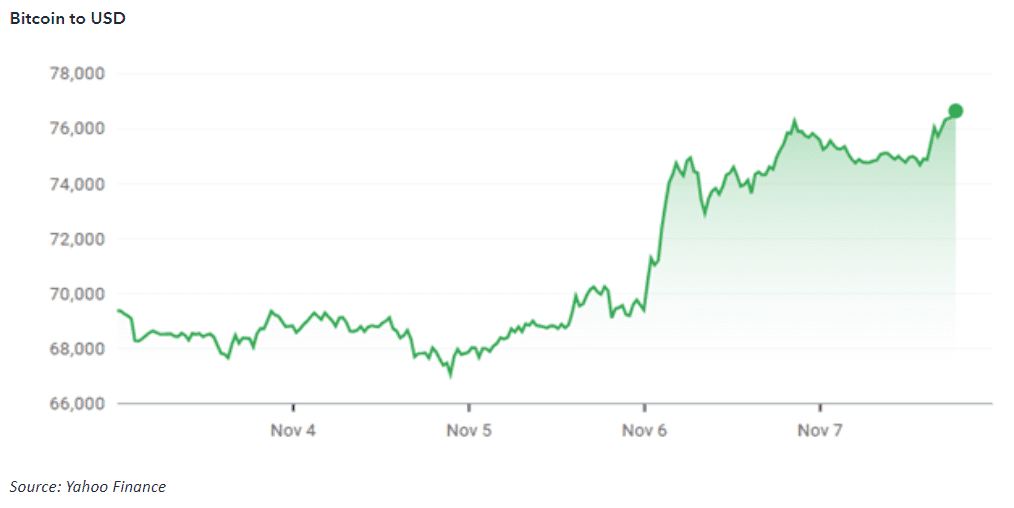
The U.S. dollar initially strengthened against other currencies but later relinquished some gains. The cryptocurrency market soared, with Bitcoin surpassing $76,000, an all-time high. This surge was generally attributed to the Republican party’s embrace of crypto and investors pricing in a less restrictive regulatory environment for the industry.

It is important to note that while elections often spark short-term volatility, markets typically return to fundamentals once the immediate effects settle. It is prudent to note that no one can predict market performance with certainty, and most strategies do not anticipate outsized moves to persist in the long term.

Week Ahead…

This week’s economic and market review centers around inflation with Consumer Price Index (CPI) data for October set to be released. Core CPI is expected to be unchanged at 0.3% month-over-month. Headline CPI is expected to be unchanged as well at 0.2% and 2.4%, for both month-over-month and year-over-year, respectively. Investors will pay close attention to these rates as concerns of possible reinflation have started to worry some market participants, which could limit the Fed’s rate cut regime.

Thursday we will get Producer Price Index (PPI) data which is expected to rise to 0.2% month-over-month from last month’s 0.0%. Crude oil inventories will also be closely watched following Trump’s election and unrest in the Middle East. Additionally, Fed Chairman Powell is expected to speak again on Thursday. Market participants will be curious what Powell has to say following CPI numbers as well as expand on last week’s comments regarding the election and working with President Trump.

Finally, we finish the week with retail sales numbers for October, which will be watched as we enter into the holiday months of the year. Core retail sales are expected to be lower, with a month-over-month change of 0.2% versus 0.5%. Headline retail sales are expected to be 0.3% versus last month’s 0.4% month-over-month.

This content was developed by Cambridge from sources believed to be reliable. This content is provided for informational purposes only and should not be construed or acted upon as individualized investment advice. It should not be considered a recommendation or solicitation. Information is subject to change. Any forward-looking statements are based on assumptions, may not materialize, and are subject to revision without notice. The information in this material is not intended as tax or legal advice.

Investing involves risk. Depending on the different types of investments there may be varying degrees of risk. Socially responsible investing does not guarantee any amount of success. Clients and prospective clients should be prepared to bear investment loss including loss of original principal. Indices mentioned are unmanaged and cannot be invested into directly. Past performance is not a guarantee of future results.

The Dow Jones Industrial Average (DJIA) is a price-weighted index composed of 30 widely traded blue-chip U.S. common stocks. The S&P 500 is a market-cap weighted index composed of the common stocks of 500 leading companies in leading industries of the U.S. economy. The NASDAQ Composite Index is a market-value weighted index of all common stocks listed on the NASDAQ stock exchange.

Market Commentary | November 4th, 2024

Market Commentary | November 4th, 2024

Week in Review…

With this past week being the last full week before investors go to the election polls, labor market numbers and inflation were the focus as markets struggled to overcome a surprise in payroll numbers.

  • The S&P 500 fell 1.37%, continuing a two-week negative streak
  • The Dow Jones Industrial Average was slightly negative at 0.15%
  • The Nasdaq finished the week down 1.50%, snapping a seven-week positive streak
  • The 10-Year Treasury yield ended the week at 4.38%

This last week was an important week as market participants updated their forecasts and debated the direction of the economy and interest rates alike. Looking back, the data released last week can loosely be grouped into three buckets: labor, economic/inflation, and earnings data.

The reports pertaining to the labor market last week seemed to indicate a solid labor market. The biggest headline from last week was the Bureau of Labor Statistics’ Nonfarm Payroll report that fell significantly short of expectations. However, this report was quickly written off as noise due to hurricane disruptions and union strikes. This consensus has been validated by a host of supplemental and surrounding data. For example, ADP Nonfarm Payroll showed a significant number of jobs had been added during October. Also, surrounding data like initial jobless claims, continuing jobless claims, and average hourly earnings all exceed expectations. Furthermore, the unemployment rate remained unchanged at 4.1% as well. The only miss was the Job Openings and Labor Turnover Survey (JOLTS) report on Tuesday. In aggregate, the labor market appears to be on solid footing.

Last week also provided a chance for markets to evaluate the directional trends in the economy and inflation. On Thursday the Bureau of Economic Analysis preliminary Q3 gross domestic product (GDP) showed the economy may be cooling, as GDP was 2.8% quarter-over-quarter compared to an estimated 3%. On the other hand, demand within the economy appears to be robust with pending home sales and crude oil beating estimates by a wide margin. Thursday’s Core Personal Consumption Expenditures (PCE) report showed inflation remains stubbornly above the Fed’s 2% target at 2.7%. Both economic activity and inflation are important inputs for nominal yields and as a result of last week, the market will have to navigate pricing treasuries with somewhat mixed signals.

Finally, earnings were strong for most of the mega cap stocks last week. Microsoft, Google, Amazon, and Meta reported earnings beating estimates. Trading for the week was mixed as markets priced in management’s forward guidance. Apple was the lone mega cap that was unable to beat estimated earnings. All in all, earnings continue to be strong.

Spotlight

A Look at Q3 Fund Flows

As we move into the last quarter of the year, we take a look at fund flows and see how investors are allocating given equity valuations and potential future rate cuts on the horizon. Year to date (YTD), we continue to see investors move from U.S. equities into fixed income broadly in both taxable and municipal bonds.

Overall, the total net flow across all categories for the year was $749,428 million, indicating robust activity in the investment landscape. Taxable Bonds has had a YTD net flow of $351,210 million, leading all categories. Over the past year, the net flow reached $388,710 million, reflecting strong investor interest given valuations in equities as well as potential rate cuts in the future. Compared to September 2023, the market share slightly decreased from 16.49% to 15.61%. Despite this small decline, Taxable Bonds remain a significant category in the market and rank third behind equities and money markets.

Equities have had a more U.S.-dominated year so far. In September 2024, U.S. Equity had a market share of 42.69% with a YTD net flow of $52,487 million, while International Equity had a market share of 11.98% with a YTD net flow of $10,947 million. Compared to September 2023, U.S. Equities’ market share increased from 39.63% to 42.69%, and International Equities’ market share slightly decreased from 12.06% to 11.98%.

Regarding cash, Money Market funds had a YTD net flow of $325,177 million, reflecting their continued popularity among investors. With a market share of 17.37%, they remain a significant portion of the investment landscape. Despite their substantial inflows, Money Market funds still represent cash on the sideline, indicating that many investors prefer to keep their assets in liquid, low-risk investments given market valuations and concerns around the election.

In September 2024, Actively Managed funds had a YTD net flow of $214,611 million and a market share of 57.09%, maintaining their top rank. However, this is a decrease from a quarter ago when actively managed strategies experienced significant outflows, reversing the revitalization seen in 2022 and 2023. Passively managed funds, with a YTD net flow of $534,818 million and a market share of 42.91%, have continued to attract more investor interest, reflecting a growing preference for passive management strategies we have seen over the last decade.

Compared to a quarter ago, where passive strategies saw $605 billion in inflows over the past year, the trend has persisted with substantial inflows in 2024. Despite actively managed funds holding a larger share of total net assets at $19.4 trillion compared to $13.8 trillion for passive funds, their market share has fallen below 60% year to date. This shift is likely due to investors favoring lower cost indexing versus higher cost active management within traditional asset classe

Week Ahead…

Next week’s economic and market review centers around the anticipated rate cut and its implications on market sentiment, against the backdrop of the upcoming election. With the election approaching, markets have been cautiously optimistic, as investors are gauging potential policy changes while closely tracking economic indicators. While political uncertainties often create short-term volatility, the market appears relatively stable as of now.

The Federal Reserve is widely expected to implement a 25 basis points (bps) rate cut next week, following a 50 bps cut during their September meeting. This expectation reflects a trend of slowing inflation and slightly softer-than-expected GDP growth over the past couple months, which has signaled to the Fed that a moderate easing could help sustain economic momentum. However, expectations for a more aggressive 50 bps cut remain low, as recent data, such as the ADP jobs report, show no signs of a significant economic downturn. Job market resilience and improving consumer sentiment over the past quarter underscore the Fed’s current strategy of gradual adjustments rather than abrupt rate cuts.

As we approach the year end, market expectations align closely with the Fed’s own projections released during September, where a cautious yet steady path was indicated. The market is pricing in a high likelihood of another 25 bps rate cut during the December meeting, barring any sudden economic changes. Investors are already factoring in this anticipated rate trajectory, which could bring further stability to equities and bonds. As a result, markets may see modest gains if the Fed’s actions next week align with these projections, providing a smoother close to the year as rate adjustments become more predictable.

This content was developed by Cambridge from sources believed to be reliable. This content is provided for informational purposes only and should not be construed or acted upon as individualized investment advice. It should not be considered a recommendation or solicitation. Information is subject to change. Any forward-looking statements are based on assumptions, may not materialize, and are subject to revision without notice. The information in this material is not intended as tax or legal advice.

Investing involves risk. Depending on the different types of investments there may be varying degrees of risk. Socially responsible investing does not guarantee any amount of success. Clients and prospective clients should be prepared to bear investment loss including loss of original principal. Indices mentioned are unmanaged and cannot be invested into directly. Past performance is not a guarantee of future results.

The Dow Jones Industrial Average (DJIA) is a price-weighted index composed of 30 widely traded blue-chip U.S. common stocks. The S&P 500 is a market-cap weighted index composed of the common stocks of 500 leading companies in leading industries of the U.S. economy. The NASDAQ Composite Index is a market-value weighted index of all common stocks listed on the NASDAQ stock exchange.
Copyright © 2025
Elsass Financial Group

Weekly Market Commentary | October 28th, 2024

Weekly Market Commentary | October 28th, 2024

Week in Review…

The major indices exhibited mixed performance for the week ending October 25, 2024.

  • The S&P 500 declined by 0.96%, ending its six-week winning streak
  • The Dow Jones Industrial Average fell by 2.68%, also recording its first weekly loss after six consecutive weeks of gains
  • The tech-heavy Nasdaq Composite continued its upward trajectory, finishing the week 0.14% higher and extending its winning streak to seven weeks
  • The 10-Year Treasury yield concluded the week at 3.90%

The Federal Reserve’s latest Beige Book, which reports on current economic conditions across the 12 Federal Reserve Districts, indicated stagnant growth in most regions over the past month. Manufacturing continues to show weakness, and consumer data revealed that shoppers across all income levels, including higher-income brackets, are increasingly seeking lower-priced alternatives for goods and services.

U.S. initial jobless claims decreased by 15,000 to 227,000, while continuing claims rose to 1.897 million for the week ending October 12. Additionally, U.S. Purchasing Managers’ Indices (PMIs) suggested strong economic growth at the start of the fourth quarter, with both Services PMI and Manufacturing PMI advancing in October.

The University of Michigan’s consumer sentiment index increased to 70.5 for October, up from 68.9 in the previous month. With inflation expectations easing, consumers are expressing optimism about the future of the economy. Economists will be closely monitoring this trend to see if it continues.

Existing home sales in September declined 1% from the previous month to a seasonally adjusted annual rate of 3.84 million, marking the lowest level since October 2010. In contrast, new home sales rose to their highest levels since May 2023, increasing 4.1% to 738,000 units on a seasonally adjusted annual basis. The average price of new homes has decreased by approximately 3% over the past year, while new home completion has increased by 40% compared to pre-pandemic levels.

Spotlight

Growth of Defined Outcome ETFs

Defined Outcome ETFs, also known as buffer ETFs, offer investors predetermined range of outcomes over specific periods, blending downside protection with upside potential. These funds have gained popularity among risk-conscious investors navigating volatile markets.

Growth of Assets and Funds

The popularity of Defined Outcome ETFs has surged in recent years, driven by market volatility and investors’ desire for more predictable returns. Per Morningstar, “Assets in defined outcome ETFs have grown to $22 billion as of January 2023 from approximately $183 million as of December 2018. The number of products jumped to 169 ETFs (in 2023) available from fewer than 10.” This rapid growth was attributed to several factors:

  • Striking a balance between equity volatility and fixed income returns
  • Offering some downside protection while allowing for some upside participation
  • Providing the liquidity, transparency, and tax efficiency inherent in the ETF structure

Types of Defined Outcome ETFs

While a detailed examination of their structural design is beyond the scope of this discussion, Defined Outcome ETFs generally fall into three primary categories:

  • Funds With Upside Cap: These funds buffer a range of losses while capping returns beyond a certain point. This is the most common approach.
  • Funds With Partial Upside Exposure: These ETFs provide downside protection by capturing only a portion of positive index returns instead of implementing a cap.
  • Downside Floor: This strategy may offer maximum loss protection in an extreme down market with a lower cap on gains which may provide returns higher than CDs or Treasury bills. However, in a market with “average” volatility, it may offer no protection at all.

Some providers also offer fund-of-funds structures aimed at providing more flexibility, albeit with higher fees and fluctuating upside cap.

Cost of Protection

While Defined Outcome ETFs offer attractive benefits, they come with certain trade-offs:

  • Higher fees (typically 70-80 basis points above traditional S&P 500 ETFs)
  • Most do not pass through dividends from underlying stocks
  • Capped upside potential may result in missed gains during strong market rallies

 The effectiveness of Defined Outcome ETFs depends on several factors:

  • Market Performance: The actual performance of the underlying index or asset during the outcome period
  • Buffer Level: The amount of downside protection offered by the ETF
  • Cap Level: The maximum return potential of the ETF. It is occasionally referred to as the Cap Rate, though this term has a distinct meaning in the context of real estate investments.
  • Timing: When an investor enters and exits the investment relative to its outcome period
  • Fees: The expense ratio of the ETF

General Investment Structure and Investor Outcomes

Defined outcome ETFs use options strategies, making them complex before option expiration. Options have two values:

  • Intrinsic value: The difference between strike price and underlying security price
  • Extrinsic value: Additional value based on time until expiration and market volatility

At expiration, options are valued only on intrinsic value. Before expiration, most options in these ETFs have both intrinsic and extrinsic value.

The ETF’s price change relative to the S&P 500 depends on the cumulative “delta” of its options. Delta measures how much an option’s price changes when the underlying security’s price changes.

Moreover, these funds reset annually, offering a new upside cap and refreshed protection for the next 12-month period.

Defined Outcome ETFs represent a notable innovation in the ETF landscape, offering investors a tool to potentially manage risk while maintaining exposure to equity markets. Matt Kaufman, Head of Calamos Investments, notes that Buffer ETFs may present a potential solution for a large demographic of retirees by addressing longevity risks and combating inflation for this group. However, investors should carefully evaluate their personal risk tolerance, market expectations, protection costs, associated risks, and investment horizon before incorporating these products into their portfolios.

Financial professionals should be aware that Cambridge classifies Defined Outcome ETFs as liquid alternatives. As such, these investment products are subject to specific concentration guidelines that apply to Non-Conventional Funds and Traded Securities.

Week Ahead…

The upcoming week is packed with several significant economic reports that will provide crucial insights into the U.S. economy’s state. These reports will cover consumer confidence, job openings, payroll data, inflation, and manufacturing activity.

The timing of these data releases is particularly significant given the Federal Open Market Committee’s (FOMC) November meeting scheduled for the following week (November 6-7). Market participants will closely analyze this information to assess the probability of potential rate movements.

The labor market will be in the spotlight with the releases of Job Openings and Labor Turnover Survey (JOLTS) job openings, ADP Non-farm Payroll, and Nonfarm Payrolls reports.

Consumer and economic growth indicators will also be closely watched, including the Consumer Confidence (October) and preliminary Q3 gross domestic product (GDP) releases.

The Core Personal Consumption Expenditures (PCE) Price Index release will be scrutinized as the Federal Reserve continues to balance its dual mandate of price stability and maximum employment. This data may be crucial in shaping the Fed’s policy decisions.

Five of the “Magnificent 7” tech companies – Apple, Microsoft, Google, Amazon, and Meta – are scheduled to report their Q3 2024 earnings next week. These reports will provide valuable insights into the health of the tech sector and its impact on the broader economy.

Given the abundance of critical economic data and high-profile earnings reports, next week promises to be a pivotal period for financial markets and economic forecasting.

This content was developed by Cambridge from sources believed to be reliable. This content is provided for informational purposes only and should not be construed or acted upon as individualized investment advice. It should not be considered a recommendation or solicitation. Information is subject to change. Any forward-looking statements are based on assumptions, may not materialize, and are subject to revision without notice. The information in this material is not intended as tax or legal advice.

Investing involves risk. Depending on the different types of investments there may be varying degrees of risk. Socially responsible investing does not guarantee any amount of success. Clients and prospective clients should be prepared to bear investment loss including loss of original principal. Indices mentioned are unmanaged and cannot be invested into directly. Past performance is not a guarantee of future results.

The Dow Jones Industrial Average (DJIA) is a price-weighted index composed of 30 widely traded blue-chip U.S. common stocks. The S&P 500 is a market-cap weighted index composed of the common stocks of 500 leading companies in leading industries of the U.S. economy. The NASDAQ Composite Index is a market-value weighted index of all common stocks listed on the NASDAQ stock exchange.
Weekly Market Commentary | October 21st, 2024

Weekly Market Commentary | October 21st, 2024

Week in Review…

As quarterly earnings come to an end, all major indices ended the week in positive territory, as small caps led with the Russell 2000 ending the week up 1.87%, leading to signs that small cap stocks are continuing their third quarter turnaround this year. Weekly performance for the week ending October 18, 2024:

  • The S&P 500 rose last week 0.85%
  • The Dow Jones Industrial Average climbed 0.96%
  • The Nasdaq finished the week up 0.26%
  • The 10-Year Treasury yield ended the week at 4.08%

Last week the market wrapped up quarterly earnings for many of the large U.S. banks and most were able to exceed profit expectations. Drivers of these profits and future economic conditions were key takeaways from the earnings reports. Year-over-year, banks are having to spend more to retain deposits to fund their loan programs and as a result, saw a decrease in net interest margin. The Federal Reserve’s September rate cut should help reduce this cost; however, banks like JPMorgan are still expecting margin compression to continue into the next quarter. On the other hand, a major driver in bank profitability was the Investment Banking and Wealth Management divisions. Looking forward, banks like JPMorgan, Citibank, and Goldman Sachs significantly increased the amount of cash set aside for potential credit losses. 

On Thursday, the market received important updates on the overall strength of the economy. Thursday provided two indicators that consumer demand and economic activity remain strong. For starters, the Census Bureau released September month-over-month headline and Core Retail Sales. Core Retail Sales significantly exceeded expectations, coming in at 0.5%, compared to a forecasted 0.1%. The report showed that consumer demand is strong, and by extension, so is the U.S. economy. Because consumer spending accounts for a large percentage of U.S. gross domestic product (GDP), this report is viewed as a bullish indicator for future GDP forecasts.

Thursday also provided an update on crude oil inventories, which is a key indicator of economic activity/demand. Once again, economic activity and demand proved to be robust as oil inventories decreased by 3.991 million barrels.

Friday was headlined by Netflix’s blowout earnings and September housing data. Netflix reported increases in both revenues and net income. The company also reported an increase in total subscribers of 14%. On the housing front, the Census Bureau reported fewer-than-expected new building permits, and the U.S. Department of Commerce reported fewer-than expected housing starts. Both reports indicate the adverse effect higher interest rates are having on builders.

In summary, the economy appears to be doing well, and this strength is being reflected in corporate earnings. However, sluggish housing growth and potential credit losses will need to be monitored going forward.

Spotlight

How Homeownership is Being Redefined by Enviornmental Uncertainty

The numerous environmental and financial challenges resulting from recent natural disasters in the U.S. have left many Americans financially struggling, wondering what might happen next, and if there are any preventative measures that should be taken. According to an analysis published by Nature Climate Change, over 14 million U.S. properties are at risk of flooding, with annual damages exceeding $32 billion. By 2050, these numbers will rise by at least 11%, adding substantial pressure to insurers, mortgage lenders, and property owners.

Millions of Americans have been watching with an alarm as their homeowners insurance premiums have risen and their coverage has shrunk in recent years. According to LendingTree, premiums have risen 37.8% nationwide since 2019, and continued to rise 5.8% merely in the first quarter of 2024. As stated by Insurify, if a claim is made, the insurance rates will go even higher, as much as 25%, if you claim a total loss of your home. Because of this, most properties are simply covered with HO-3 (standard), while riders such as flood and earthquake insurance are being passed due to cost.

Average Annual Cost of Home Insurance 

As a result of the increasing premiums from claims and natural disasters, climate risks have become a crucial factor in the home-buying decision. Zillow has stated that more than 80% of potential home buyers now consider climate risks when choosing a home. However, it’s not just about knowing the risks; understanding how they impact long-term affordability, particularly through rising insurance costs, is just as important.

During the house-hunting process, there are five key climate risks that home buyers are considering:

  1. Flood
  2. Wildfire
  3. Wind
  4. Heat
  5. Air quality

Climate risks are a major concern for younger home shoppers, who are currently driving the housing market. The median age of today’s home buyer is 39, and first-time buyers make up 50% of all buyers. According to Zillow, Millennial and Gen Z shoppers, who comprise 54% of all home buyers, are most likely to consider climate risk when determining where to shop for a home.

Percentage of Climate Risk Considerations Per Generational Class 

As of the beginning of October, all three major house hunting sites (Zillow, Realtor.com, and Redfin) provide ratings for each climate criteria pertaining to the area of every individual listing. Understanding a home’s vulnerability to risks like flooding and wildfires also plays an important role in other aspects of a homeowner’s financial health, such as financial planning, since the cost of insuring a property against climate-related risks can dramatically influence monthly payments and the affordability of a home. For sellers, having a clear understanding of a property’s climate risk can be equally valuable. Sellers can take proactive measures to mitigate hazards, such as flood-proofing or adding fire-resistant landscaping, which can enhance the home’s appeal and market value, and minimize unexpected issues at closing.

With these five published climate-risk criteria, a new concerning trend has emerged — many homes in climate-risk areas are overvalued. For example, a study shows that properties within the 100-year flood zone are priced at about 8.5% higher than they should be, as flood risks are often not fully accounted for in market values. This has sparked fears of a potential real estate bubble in these risky areas, as home prices may eventually deflate, leaving homeowners vulnerable to financial losses. With flood risks not properly factored into home values, many Americans could face significant losses in home equity, causing ripple effects on local governments heavily relying on property taxes.

Municipalities all over the U.S. will need to make their communities more resilient despite climate change. According to Redfin, paying for mitigation and adaptation measures will likely need to be funded through an increase in property taxes and fees. Additionally, as people leave coastal communities due to flooding, or tropical areas due to hurricanes, the tax base in those areas will shrink, further driving up taxes for those that remain. 

With increased property taxes and a decrease in the resale value of homes with high climate risk, the local GDP of that area will start to deteriorate due to less economic activity and residential occupancy. Consequently, these areas will start to become underdeveloped, and eventually become deserted. Furthermore, since insurance companies are charging more for coverage in climate-risk areas due to the increased risk that they will have to pay out claims, catastrophe bonds are gaining more market share. These bonds provide the insurance company sources of funding when such a condition occurs, also providing short-term diversification benefits against market and economic risks for the investor.

Week Ahead…

Looking ahead to next week, we anticipate a relatively quiet period for economic data. We will receive the first reports on Existing Home Sales and New Home Sales since the Federal Reserve began cutting interest rates, which will help us assess the current state of the residential real estate market. It’s important to note that the effects of interest rate changes take time to reflect in housing data indicators, and market participants are expecting minimal changes with these upcoming releases.

Market participants will closely monitor the Manufacturing and Services Purchasing Managers Index (PMI) on Thursday. The PMI offers a forward-looking view on the economy’s health, which will help shape the market’s expectations regarding future interest rate cuts.

The University of Michigan’s consumer sentiment data, set for release on Friday, will be closely observed. Last month’s sentiment was 1.2 index points lower than October, but remained well within the margin of error, following two straight months of gains. While inflation expectations have eased substantially, consumers will likely continue to express frustration over high prices. Consumers will likely remain cautious with elevated geopolitical tension and the upcoming election.

This content was developed by Cambridge from sources believed to be reliable. This content is provided for informational purposes only and should not be construed or acted upon as individualized investment advice. It should not be considered a recommendation or solicitation. Information is subject to change. Any forward-looking statements are based on assumptions, may not materialize, and are subject to revision without notice. The information in this material is not intended as tax or legal advice.

Investing involves risk. Depending on the different types of investments there may be varying degrees of risk. Socially responsible investing does not guarantee any amount of success. Clients and prospective clients should be prepared to bear investment loss including loss of original principal. Indices mentioned are unmanaged and cannot be invested into directly. Past performance is not a guarantee of future results.

The Dow Jones Industrial Average (DJIA) is a price-weighted index composed of 30 widely traded blue-chip U.S. common stocks. The S&P 500 is a market-cap weighted index composed of the common stocks of 500 leading companies in leading industries of the U.S. economy. The NASDAQ Composite Index is a market-value weighted index of all common stocks listed on the NASDAQ stock exchange.