Market Commentary | January 27th, 2025

Market Commentary | January 27th, 2025

Week in Review…

As the new president took office this past week, headlines were dominated by the potential impact of campaign promises turning into executive actions.

  • The S&P 500 ended up 1.74%
  • The Dow Jones Industrial Average led major indices up 2.15%
  • The tech-heavy Nasdaq finished up 1.65%
  • The 10-Year Treasury yield concluded at 4.59%

Financial markets responded by actively assessing which sectors stand to gain or lose in the new political landscape, with particular scrutiny on the effects of potential tariffs. However, amidst this political focus, important economic data also emerged, offering insights into the underlying health of the economy.

Strong Corporate Earnings: Several major corporations reported strong Q4 earnings this week, exceeding analysts’ expectations. Streaming services, for example, saw a significant gain, driven by the addition of new subscribers.Major banks outperformed Q4 expectations and capped off a strong earning season, reflecting continued strength within the banking sector.

Mixed Signals in Demand: While the housing market showed positive signs with December’s Existing Home Sales exceeding expectations for the third consecutive month, indicating robust consumer spending, the oil market presented a contrasting picture. Crude oil inventories fell short of analyst forecasts for the fourth consecutive week, suggesting sluggish oil demand and potentially weaker overall economic demand.

Softness Around the Edges: Despite these positive earnings reports, some economic indicators revealed areas of concern. The labor market showed signs of weakness with both Continuing and Initial Jobless Claims exceeding expectations for the second consecutive week. This warrants close monitoring for potential labor market softness and rising unemployment. Furthermore, consumer sentiment weakened as indicated by softer-than-expected preliminary Services Purchasing Managers’ Index (PMI) data and disappointing Michigan Consumer Expectations and Sentiment data.  Markets will closely analyze this data as it may signal a weakening consumer.

Spotlight

A Look at Q4 Fund Flows

With January starting off strong for equities, we take a look back at last quarter and summarize fund flows into mutual funds and ETFs to see where investors have positioned for 2025.


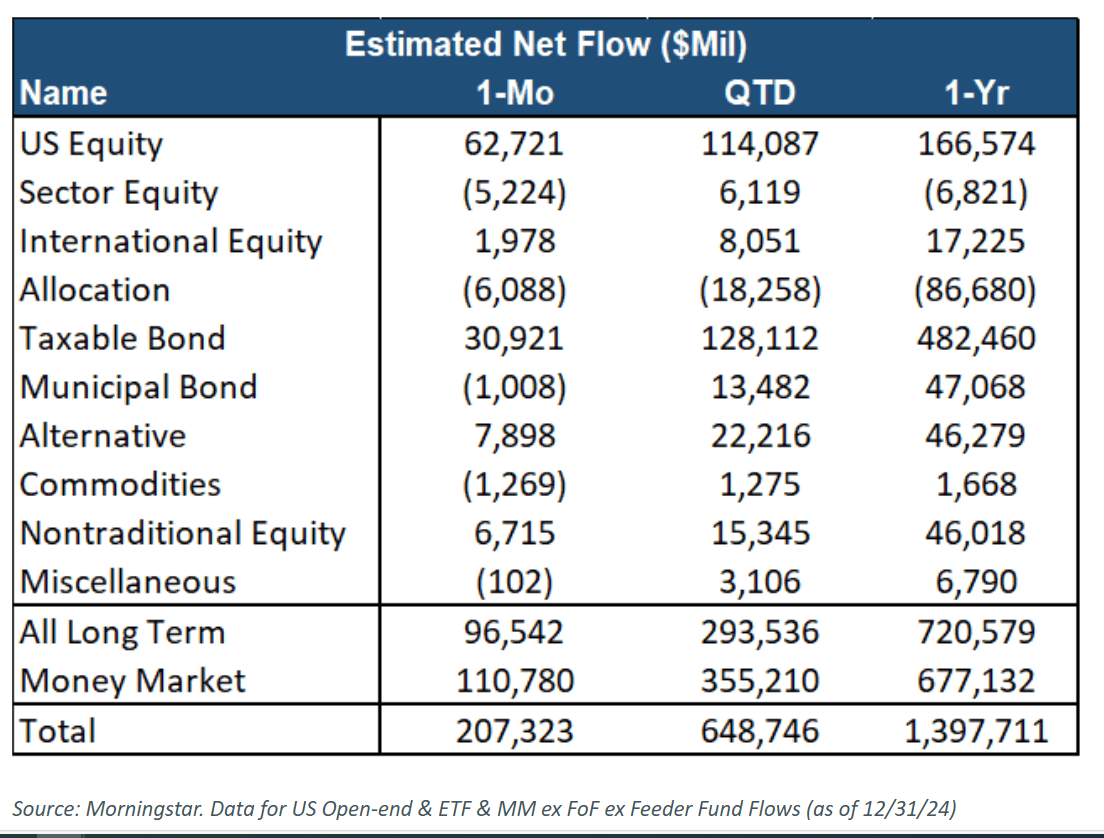
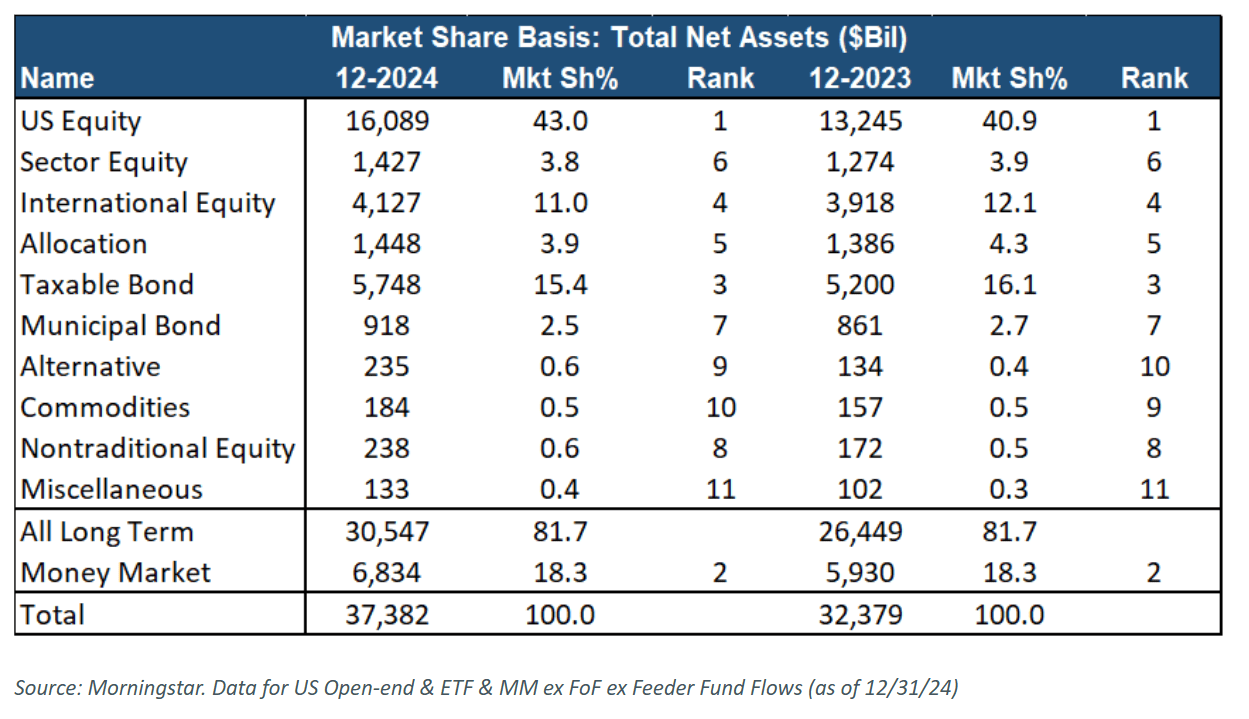
Flows for 2024 were positive for risk assets, as flows to U.S. equity mutual funds and ETFs took in over $166 billion. With broad concerns about slow growth and home country bias, international equities took in only $17 billion for the year. In bonds, taxable bond flows were the big winner taking in over $482 billion in flows as investors looked to lock in higher yields as the Fed continues its rate cutting regime. Despite the flows to risk assets, money markets took in nearly $677 billion as a whole or 48% of every dollar invested into mutual funds and ETFs. This indicates that investors may still be hesitant to allocate to risk assets. The most interesting takeaway is that 68% of flows into equities came in Q4, which could be indicative of investors’ hopes for stocks in 2025.


*Click image to expand

In 2024, global equities as a whole grew to $20 trillion, up from $17 trillion at the end of 2023. Specifically, U.S. equities rose to $16 trillion from $13 trillion at the end of 2023, and currently account for 43% of all long-term assets. Despite strong positive flows in 2024, taxable bonds fell on a market share basis from 16.1% to 15.4%. Another surprise for 2024 was the growth in alternative funds, as the asset class grew by $100 billion from $134 billion.

Moving forward, as the economic backdrop has created tailwinds for risk assets, investors have been positioning equities as the asset class to be in for 2025.

Week Ahead…

Next week, we will have quite a busy week in economic data releases. On Tuesday, we will receive the consumer confidence data from the Conference Board; however, this reading likely will only partially capture the impact of the new administration. The market will be looking for signs of how consumer sentiment is evolving amidst recent policy changes and ongoing economic conditions.

On Wednesday, the Federal Open Market Committee (FOMC) will hold its meeting, and market expectations are leaning towards the Fed maintaining the current federal funds rate. Given the recent inflation data, a resilient job market, and the influence of the new administration, the consensus believes the Fed will opt for a wait-and-see approach.

On Thursday, we will receive the 4Q 2024 gross domestic product (GDP) report and initial jobless claims. The GDP report will provide insight into the overall economic growth, helping market participants gauge the strength of the economy. Meanwhile, initial jobless claims will shed light on the health of the labor market, indicating whether layoffs are increasing or if employment conditions are stabilizing. Lastly, on Friday, the Personal Consumption Expenditure (PCE) Index and Chicago PMI data will be released. The PCE data is crucial for understanding inflation trends, as it is the Fed’s preferred measure of price changes. Meanwhile, the Chicago PMI will provide insights into manufacturing activity in the region. These indicators will be essential for gauging inflationary pressures and overall economic momentum, influencing market sentiment and expectations for future Fed actions.

1Kessel, Andrew. “Netflix Stock Pops on Higher Revenue Outlook, $15B Buyback Boost.” Investopedia, January 22, 2025. https://www.investopedia.com/netflix-earnings-q4-fy-2024-8777613.

This content was developed by Cambridge from sources believed to be reliable. This content is provided for informational purposes only and should not be construed or acted upon as individualized investment advice. It should not be considered a recommendation or solicitation. Information is subject to change. Any forward-looking statements are based on assumptions, may not materialize, and are subject to revision without notice. The information in this material is not intended as tax or legal advice.

Investing involves risk. Depending on the different types of investments there may be varying degrees of risk. Socially responsible investing does not guarantee any amount of success. Clients and prospective clients should be prepared to bear investment loss including loss of original principal. Indices mentioned are unmanaged and cannot be invested into directly. Past performance is not a guarantee of future results.

The Dow Jones Industrial Average (DJIA) is a price-weighted index composed of 30 widely traded blue-chip U.S. common stocks. The S&P 500 is a market-cap weighted index composed of the common stocks of 500 leading companies in leading industries of the U.S. economy. The NASDAQ Composite Index is a market-value weighted index of all common stocks listed on the NASDAQ stock exchange.

Market Commentary | January 21st, 2025

Market Commentary | January 21st, 2025

Week in Review…

Major market indices concluded the week with positive returns, while the Treasury yield began its descent from its historical uptrend. A drop in the Treasury yield typically indicates heightened demand for safer investments, often reflecting investor concerns about economic growth or market volatility.

  • The S&P 500 closed up 2.91%
  • The Dow Jones Industrial Average was higher, up 3.69%
  • The tech-heavy Nasdaq rose, up 2.85%
  • The 10-Year Treasury yield concluded at 4.62%

Last week we received three key reports—Producer Price Index (PPI), Consumer Price Index (CPI), and retail sales— which provided insights into inflation and consumer behavior.

The week began with the release of the PPI on Tuesday, which showed a 3.3% increase year-over-year for 2024. Notably, PPI inflation has been accelerating, running at an annualized rate above 3% over the past three months. While the PPI measures price changes at the producer level, it doesn’t directly capture the inflation consumers experience at stores and restaurants. For that, markets turned to Wednesday’s CPI release.

The CPI report was the highlight of the week. Core CPI, which excludes volatile food and energy prices, rose 0.2% month-over-month, below the 0.3% estimate. On an annual basis, core inflation rose to 3.2%, also under the forecasted 3.3%. This softer-than-expected inflation data sparked optimism in financial markets, with the major indices recording their best daily performance since November. The bond market also rallied, with the 10-year Treasury yield dropping by 15 bps from the day prior. Investors interpreted the report as a sign that inflation pressures may be easing, increasing the likelihood that the Federal Reserve could hold off on further interest rate hikes.

Thursday’s retail sales report showed a 0.4% increase in December, slightly below expectations. However, the data still pointed to resilient consumer spending, suggesting that holiday shopping remained robust despite higher interest rates. This resilience provides a key support for the broader economy as consumer spending accounts for nearly 70% of gross domestic product (GDP).

Spotlight

The Financial Fallout of Revenge Buying: A Deep Dive into Consumer Debt

Revenge buying refers to the surge in consumer spending that occurs after a period of restricted shopping opportunities, such as during lockdowns or economic downturns. This phenomenon was notably observed after the COVID-19 pandemic, when people, eager to make up for lost time, began splurging on luxury items and non-essential goods.

While revenge buying can provide a temporary boost to the economy, it often leads to significant financial challenges for consumers. Many individuals turn to credit cards to fund their purchases, resulting in mounting debt. According to The Wall Street Times, the total amount owed for credit card debt in the U.S. is surpassing $1 trillion. This surge in debt is exacerbated by high interest rates, making it increasingly difficult for consumers to manage their finances.

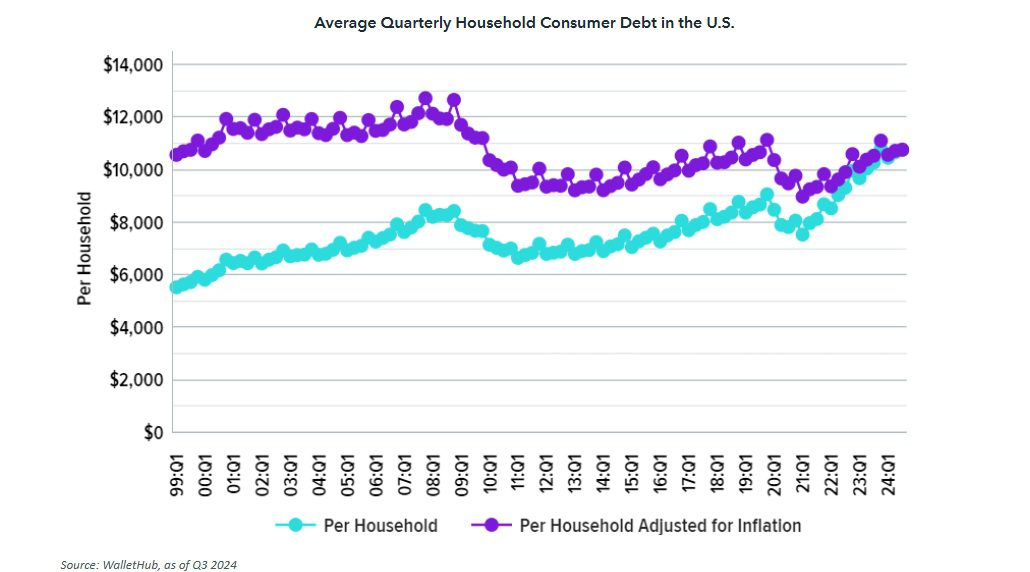
The consequences of this trend are severe. Defaults on credit card payments have skyrocketed, with many Americans struggling to keep up with their monthly bills. As stated by WalletHub, the average household credit card debt is now over $10,000, putting immense pressure on families and individuals. High-income households may be able to weather this storm, but lower-income consumers are particularly vulnerable, often finding themselves with zero savings and high levels of financial stress.

Consumer spending is a critical driver of the U.S. economy, accounting for nearly 70% of the GDP, according to The Wall Street Times. When consumers engage in revenge buying, it can initially boost the stock market, particularly in sectors like retail, technology, and consumer discretionary. Companies in these sectors often see higher revenues and profits, which can lead to increased stock prices.

However, the long-term effects can be more complex. As consumers rack up credit card debt and struggle to make payments, their financial instability can lead to reduced spending in the future. This reduction in consumer spending can negatively impact corporate earnings, causing stock prices to fall. Additionally, high levels of consumer debt can lead to increased defaults, which can create broader economic instability and affect investor confidence.

Investors may also become more cautious, shifting their focus to safer assets like bonds or gold, which can lead to volatility in the stock market. The bond market can be particularly sensitive to changes in consumer spending, as high spending can lead to inflationary pressures, prompting the Federal Reserve to raise interest rates. Higher interest rates can decrease bond prices, as new bonds are issued with higher yields.

While revenge buying reflects a desire to reclaim normalcy and indulge after periods of deprivation, it can lead to significant financial strain. The resulting credit card debt and associated struggles highlight the need for better financial planning and awareness among consumers. The stock market and investing landscape are also affected, with potential short-term gains followed by long-term risks.

Week Ahead…

This week will be a shorter trading week than normal due to the Martin Luther King Jr. Day holiday on Monday, closing the market for the day. Despite this, there are still a few key economic reports to watch. Below are some important topics to monitor throughout the week:

Treasury Auctions: This week, the U.S. Department of Treasury will auction 20-year bonds and 10-year Treasury Inflation-protected Securities (TIPS) notes. The long end of the yield curve is primarily influenced by supply and demand rather than monetary policy. Consequently, long-term inflation expectations play a significant role in determining long-term yields. Additionally, the 10-year TIPS auction will allow markets to assess 10-year breakeven rates, a crucial indicator of inflation expectations that provides insights into future inflation and its potential impact on investment returns.

Housing: On Friday, the National Association of Realtors will release the December Existing Home Sales and the month-over-month percentage change in Existing Home Sales. These reports offer insights into the housing market’s strength and, by extension, the overall economy. The previous report (November 2024) exceeded expectations. Another positive surprise would indicate continued economic and consumer strength, especially considering the headwinds from rising interest rates for 30-year mortgages, which started the month at around 6.69% and ended at approximately 6.91%.

Survey Data: S&P Global will release the Services and Manufacturing Purchasing Managers Index (PMI) on Friday. Both indices are vital indicators of overall economic health and future GDP prospects. However, given the significant contribution of services to U.S. GDP, the performance of the Services PMI will have a greater market impact. The Services PMI did not exceed forecasts in the last report, so markets will be keen to see if this trend continues. Meanwhile, the Manufacturing PMI has been hovering near contractionary territory in recent reports, and markets will be watching to see if conditions improve or worsen.

This content was developed by Cambridge from sources believed to be reliable. This content is provided for informational purposes only and should not be construed or acted upon as individualized investment advice. It should not be considered a recommendation or solicitation. Information is subject to change. Any forward-looking statements are based on assumptions, may not materialize, and are subject to revision without notice. The information in this material is not intended as tax or legal advice.

Investing involves risk. Depending on the different types of investments there may be varying degrees of risk. Socially responsible investing does not guarantee any amount of success. Clients and prospective clients should be prepared to bear investment loss including loss of original principal. Indices mentioned are unmanaged and cannot be invested into directly. Past performance is not a guarantee of future results.

The Dow Jones Industrial Average (DJIA) is a price-weighted index composed of 30 widely traded blue-chip U.S. common stocks. The S&P 500 is a market-cap weighted index composed of the common stocks of 500 leading companies in leading industries of the U.S. economy. The NASDAQ Composite Index is a market-value weighted index of all common stocks listed on the NASDAQ stock exchange.
Market Commentary | January 13th, 2025

Market Commentary | January 13th, 2025

Week in Review…

Major market indices ended the week lower over concerns surrounding rising inflation:

  • The S&P 500 closed at -1.94%
  • The Dow Jones Industrial Average was lower at -1.86%
  • The tech-heavy Nasdaq fell to -2.34%
  • The 10-Year Treasury yield concluded at 4.77%

Inflation remained a significant theme this week. The ISM Services Purchasing Managers Index (PMI) for December surpassed expectations at 54.1, indicating a robust expansion in the services sector. However, a notable driver of this increase was the ISM Non-Manufacturing Prices index, revealing higher input costs for service providers. This suggests that inflationary pressures may be persisting. The bond market reacted negatively to this news, with the 10-year Note Auction climbing to 4.68% and the 30-year Bond Auction rising to 4.913%. The University of Michigan Inflation Expectations survey reinforced these concerns, showing both 1- and 5-year expectations significantly higher than anticipated.

Several labor reports last week pointed to a strong economy. The Job Openings and Labor Turnover Survey (JOLTS) report for November showed a higher-than-expected 8.098 million openings, indicating continued labor demand. This trend was further supported by lower-than-expected initial and continuing jobless claims. Friday brought more positive labor market news, with Nonfarm Payrolls adding 256,000 jobs in December, exceeding expectations by a significant margin. The unemployment rate also dipped to 4.1% from 4.2%.

Given this week’s data, market participants appear less optimistic about the Federal Reserve lowering interest rates. The persistence of inflationary pressures raises concerns about the potential for reigniting inflation, making the market less certain about the Fed’s ability to cut rates.

Spotlight

Initial Look at Investment Impact of the California Fires 

The recent wildfires in California have had a devastating economic impact. Preliminary estimates suggest that the total damage and economic loss could range between $135 billion and $150 billion. This makes the current wildfires potentially the costliest in U.S. history, surpassing previous records. In this week’s spotlight, we look at the initial investment impact for investors regarding the fires.

Equity and Debt Concerns

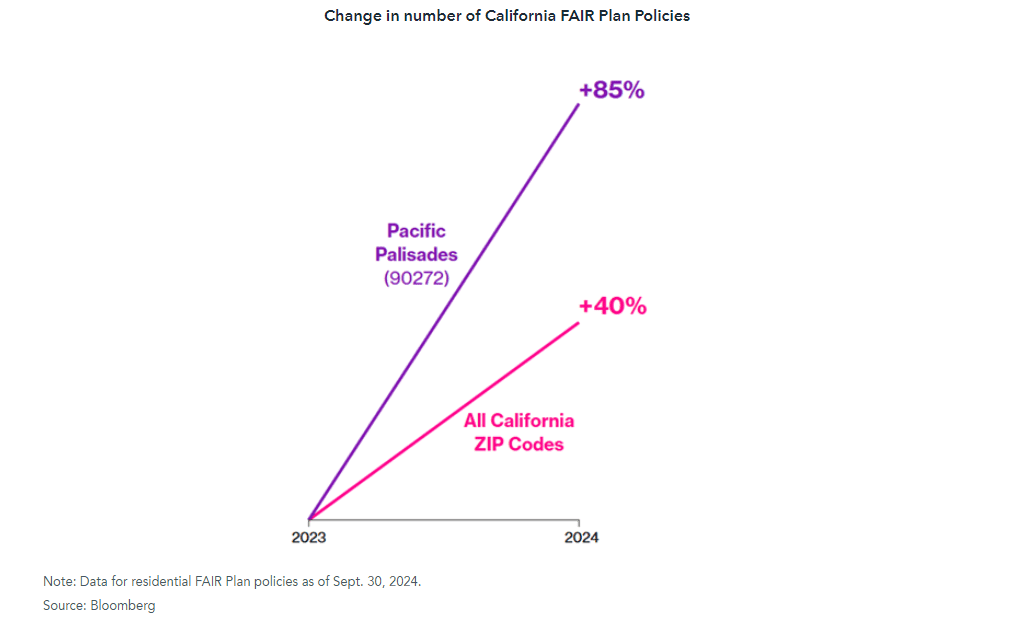
The recent wildfires in California have significantly impacted insurance companies, leading to substantial insured losses. Some insurance companies have tried to mitigate their risk and avoid certain areas. For instance, State Farm dropped around 1,600 policies in Pacific Palisades before the fires, reflecting a broader trend of insurers pulling back from high-risk areas. Allstate and Farmers Insurance have also halted underwriting in certain regions of California, leaving many homeowners relying on the California FAIR Plan (FAIR Plan). 

The financial strain has led to increased premiums and stricter underwriting practices for those willing to still insure. Those with exposure to the current fires such as Mercury Insurance and Allstate have seen their stocks drop significantly due to the fires. Additionally, the state has implemented a one-year moratorium on the cancellation or non-renewal of homeowners insurance policies in affected areas to provide some relief which could lead to longer term effects for those with exposure.

Within the insurance market, concerns around catastrophe bonds (cat bonds) have fortunately been minimal. Cat bonds are financial instruments used by insurers to transfer the risk of catastrophic events, like wildfires, to the capital markets. Approximately 12% of the $50 billion cat bond market is currently exposed to wildfire risk. Despite the recent wildfires in California, many cat bonds are expected to be minimally affected because they often bundle fire risk with larger perils like hurricanes. However, there is still concern that subsequent natural disasters could trigger losses, especially if cumulative loss thresholds are reached. In the marketplace, investors are also demanding higher interest payments to compensate for the increased risks posed by climate change and rising property values.

Municipal Market Concerns

Like many other states, California offers a public insurance option for homeowners. The FAIR Plan acts as the insurer of last resort for homeowners who can’t secure coverage in the private market, particularly in wildfire-prone areas. Funded primarily by policyholder premiums, the FAIR Plan can also request financial support from the California Infrastructure and Economic Development Bank (IBank) through bond issuance. The recent wildfires have increased pressure on the FAIR Plan, resulting in higher premiums and greater demand for coverage. IBank assists by issuing bonds to ensure the FAIR Plan has sufficient funds to meet its claims obligations. Additionally, IBank invests in wildfire risk reduction and disaster relief programs to help mitigate the impact of wildfires. As of June 30, 2023, IBank has issued a total of $52.5 billion in bonds, highlighting its significant role in financing public and private projects.

Investment Impact

While data specific to capital needs from IBank to FAIR Plan is not available, investors with exposure to California municipal bonds should take additional due diligence to their holdings to understand their potential exposure to IBank. Additionally, investors in municipal bond mutual funds and ETFs should pay attention as California is typically one of the largest state exposures in these types of funds. With wildfire concerns, there could be a drop in most CA municipal bond names as investors continue to reassess the risk of not just the current effect of municipalities but of the entire state.

In regard to equity and debt concerns, investors should understand their exposure to both the insurance and reinsurance market within their portfolios.  Along with equity exposure, investors should also look at any catastrophe bond exposure they may have in their fixed income holdings, specifically within certain income focused mutual funds and ETFs. While exposure in most funds may be limited currently, if bond traders can demand higher coupons on these bonds, we may start to see exposure to these bonds increase within core-plus and multi-sector bond funds focused on income. 

Week Ahead…

This week, several key economic indicators are set to be released, providing valuable insights into the current state of the economy. One of the most anticipated reports is the Consumer Price Index (CPI), which measures the average change in prices paid by consumers for goods and services. This report is crucial for understanding inflation trends and how they might impact purchasing power and the cost of living. Additionally, the Consumer Inflation Expectations report will be released, offering insights into how consumers perceive future inflation, which can influence spending and saving behaviors.

Another important indicator to watch is the Retail Sales Data. This report will show the total receipts of retail stores, offering a glimpse into consumer spending habits. Strong retail sales can indicate a healthy economy with confident consumers, while weaker sales might suggest economic challenges or shifts in consumer behavior. Alongside this, the Producer Price Index (PPI) will be released, measuring inflation at the wholesale level. This index reflects the average change over time in the selling prices received by domestic producers for their output, providing a broader view of inflationary pressures in the economy.

Additionally, the unemployment claims report will be released detailing the number of individuals who filed for unemployment insurance for the first time. This data is a key measure of the job market’s health and can signal changes in employment trends. The Industrial Production report will measure the output of the industrial sector, including manufacturing, mining, and utilities, providing insights into the overall industrial activity. The Crude Oil Inventories report will also be released, indicating the weekly change in the number of barrels of commercial crude oil held by U.S. firms, which can impact oil prices and broader economic conditions.

Lastly, the housing starts report will indicate the number of new residential construction projects that have begun during the month. This is an important indicator of the housing market’s health and can reflect broader economic conditions. Together, these indicators will offer a comprehensive snapshot of economic health and trends across various sectors.

This content was developed by Cambridge from sources believed to be reliable. This content is provided for informational purposes only and should not be construed or acted upon as individualized investment advice. It should not be considered a recommendation or solicitation. Information is subject to change. Any forward-looking statements are based on assumptions, may not materialize, and are subject to revision without notice. The information in this material is not intended as tax or legal advice.

Investing involves risk. Depending on the different types of investments there may be varying degrees of risk. Socially responsible investing does not guarantee any amount of success. Clients and prospective clients should be prepared to bear investment loss including loss of original principal. Indices mentioned are unmanaged and cannot be invested into directly. Past performance is not a guarantee of future results.

The Dow Jones Industrial Average (DJIA) is a price-weighted index composed of 30 widely traded blue-chip U.S. common stocks. The S&P 500 is a market-cap weighted index composed of the common stocks of 500 leading companies in leading industries of the U.S. economy. The NASDAQ Composite Index is a market-value weighted index of all common stocks listed on the NASDAQ stock exchange.

Weekly Market Commentary | January 6th, 2025

Weekly Market Commentary | January 6th, 2025

Week in Review…

Major U.S. equity indices were mostly lower this week after finishing 2024 with double-digit annual gains. For the week ending January 3, 2025:

  • The S&P 500 closed down -0.48
  • The Dow Jones Industrial Average declined by -0.60%
  • The tech-heavy Nasdaq fell -0.51%
  • The 10-Year Treasury yield concluded at 4.59%

Initial jobless claims fell to an eight-month low of 211,000 in the week ending December 28, 2024, down from 219,000 in the previous week. This decrease, along with a drop in continuing claims to 1.84 million, suggests a resilient labor market.

The National Association of REALTORS® reported that pending home sales rose by 2.2% in November 2024, marking the fourth consecutive month of increases. This growth, exceeding the forecast of 0.9%, indicates a potential rebound in the housing market. Year-over-year, pending home sales increased by 6.9%, with improvements across all four U.S. regions.

The Institute for Supply Management (ISM) reported a Manufacturing Purchasing Managers Index (PMI) of 49.3, which was slightly higher than the previous reading but still indicating contraction. The S&P Global Manufacturing PMI for December 2024 came in at 49.4, surpassing expectations but below the prior reading.

The Atlanta Fed’s GDPNow model estimates fourth-quarter 2024 real GDP growth at 2.4%, a slight decrease from its previous projection of 2.6% on January 2, 2025.

Spotlight

A Resilient 2024 – In the Rear View Mirror

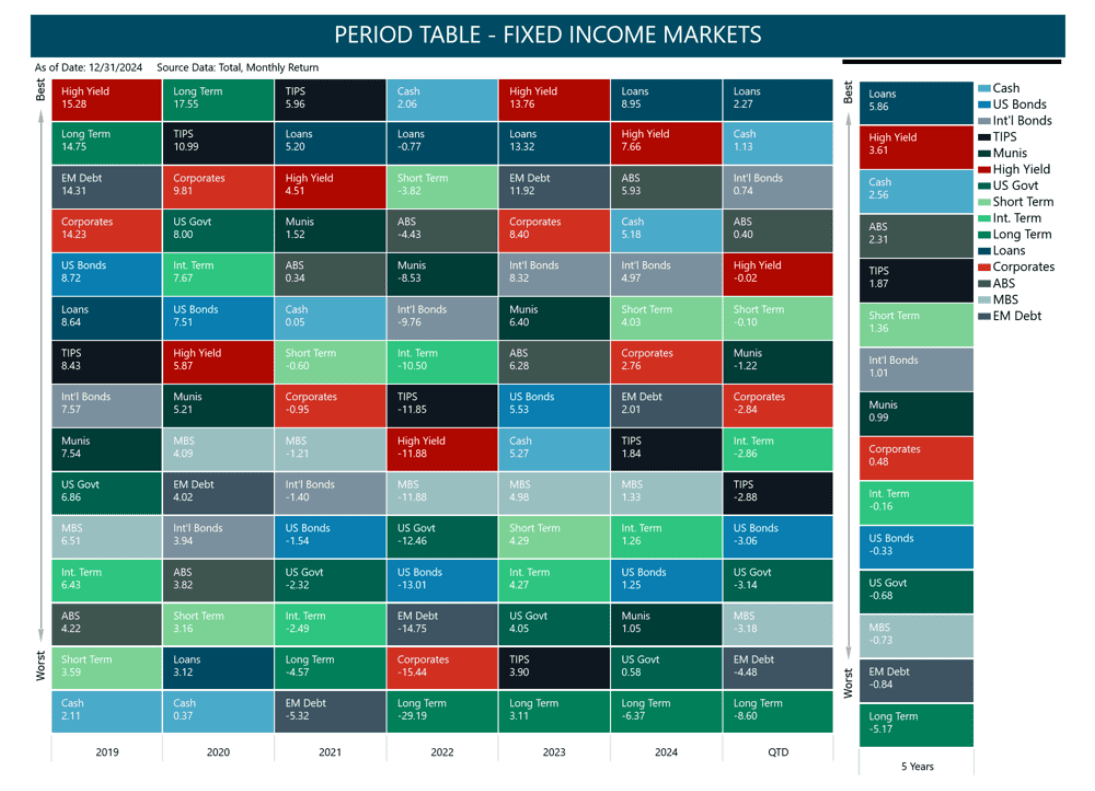
Equity markets performed strongly in 2024, driven by economic growth and solid corporate earnings, particularly in the technology sector. Fixed income saw modest gains, with leveraged loans, high-yield bonds, and asset-backed securities demonstrating strong performance against the backdrop of a robust economy. Inflation remained a persistent concern throughout 2024. The Federal Reserve cut interest rates three times, shifting to a more accommodative stance to support economic stability amid cooling inflation.

Economic Highlights

Inflation remained a persistent concern in 2024, with U.S. headline inflation at 2.7% in November, above the Fed’s 2% target. In response, the Federal Reserve implemented three 25 basis point rate cuts, bringing the federal funds rate to 4.25%-4.5% by December, while projecting only two rate cuts for 2025.

The 10-year Treasury yield, a key economic indicator, fluctuated throughout 2024, starting below 3.9% and ending at 4.57%. Geopolitical tensions in Israel and Ukraine had a modest impact on capital markets, contributing to the dollar’s safe-haven status and influencing investor sentiment.

The U.S. dollar showed strength in early 2025, continuing its robust performance from 2024. Its strength was also partly attributed to the Fed’s stance, interest rate differentials, and expectations surrounding President-elect Trump’s pro-growth policies. Despite these challenges, the U.S. economy demonstrated resilience, with GDP growth reaching 3.1% in the third quarter of 2024.

Broad Asset Class Performance

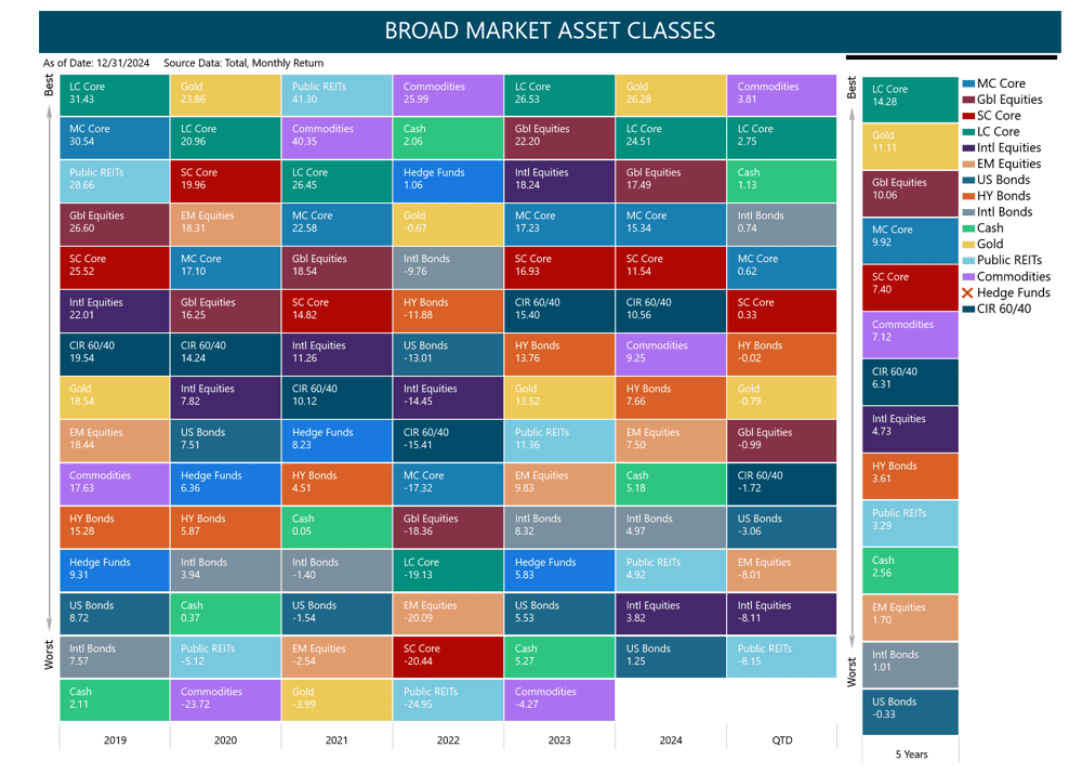
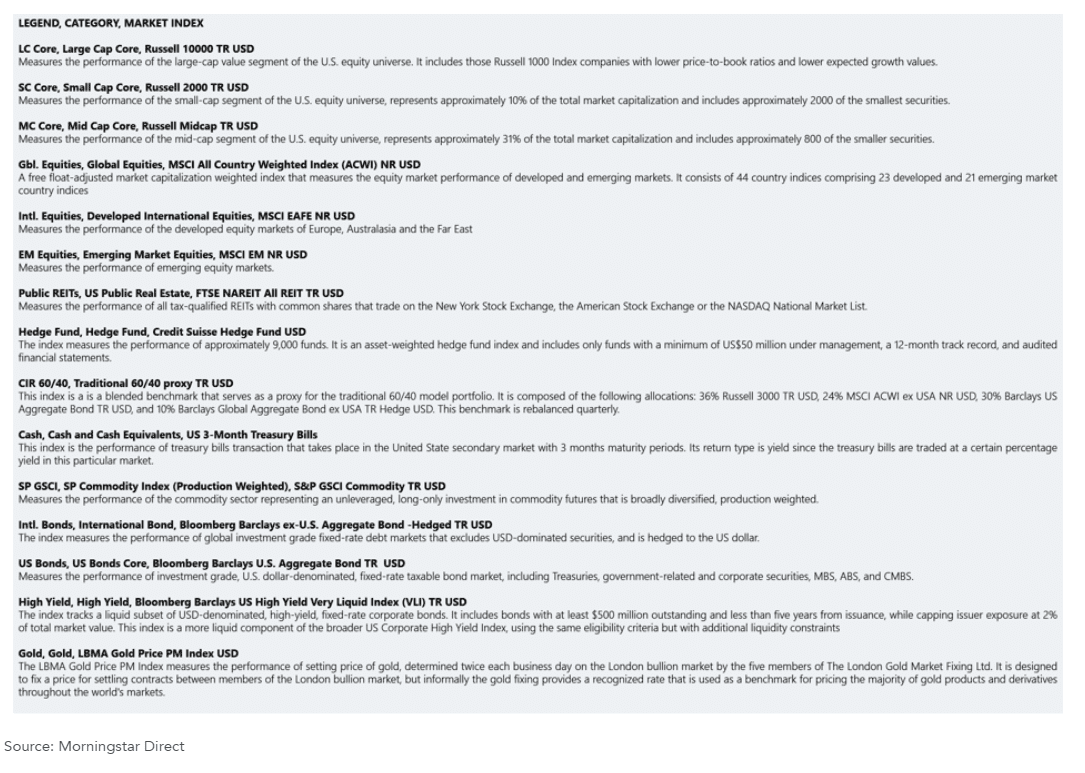
In 2024, Gold, Large Cap Core equities, and Global Equities emerged as top performers. U.S. Bonds underperformed, while Commodities, represented by the S&P GSCI, rallied in the fourth quarter. This rally was driven by gains in industrial metals, gold, and various agricultural commodities. U.S. real estate investment trusts (REITs) lagged behind the broader market in the last quarter of the year.

Equity Markets

Broad Equity Markets

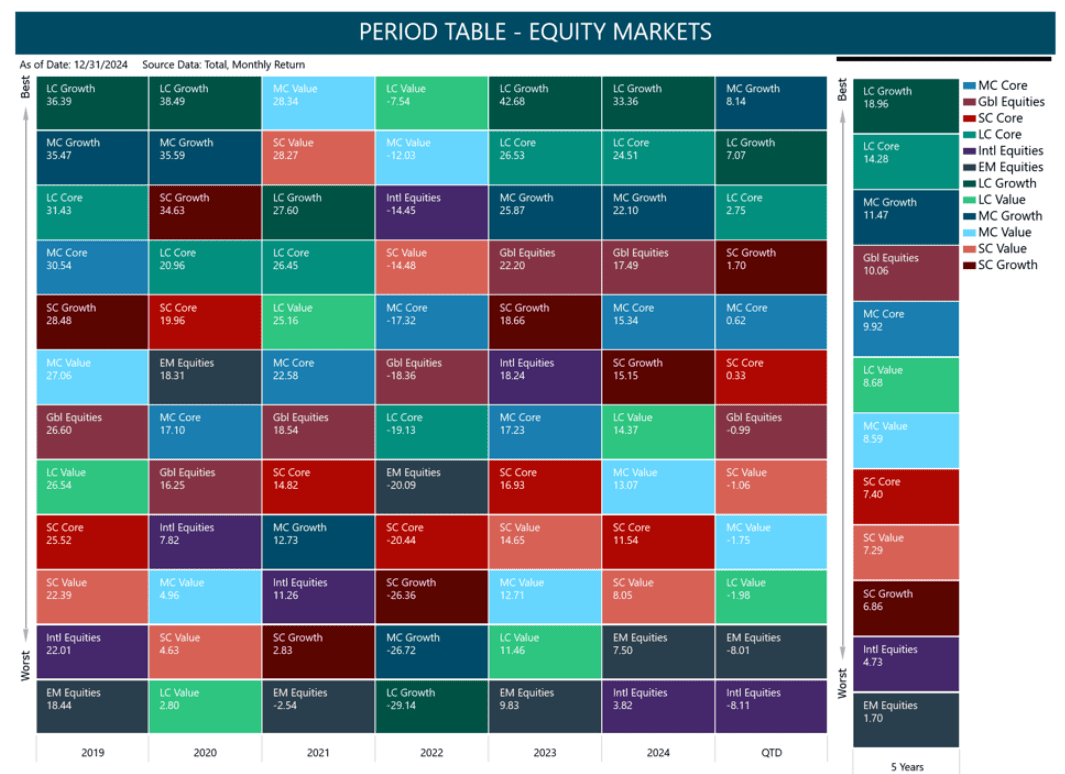
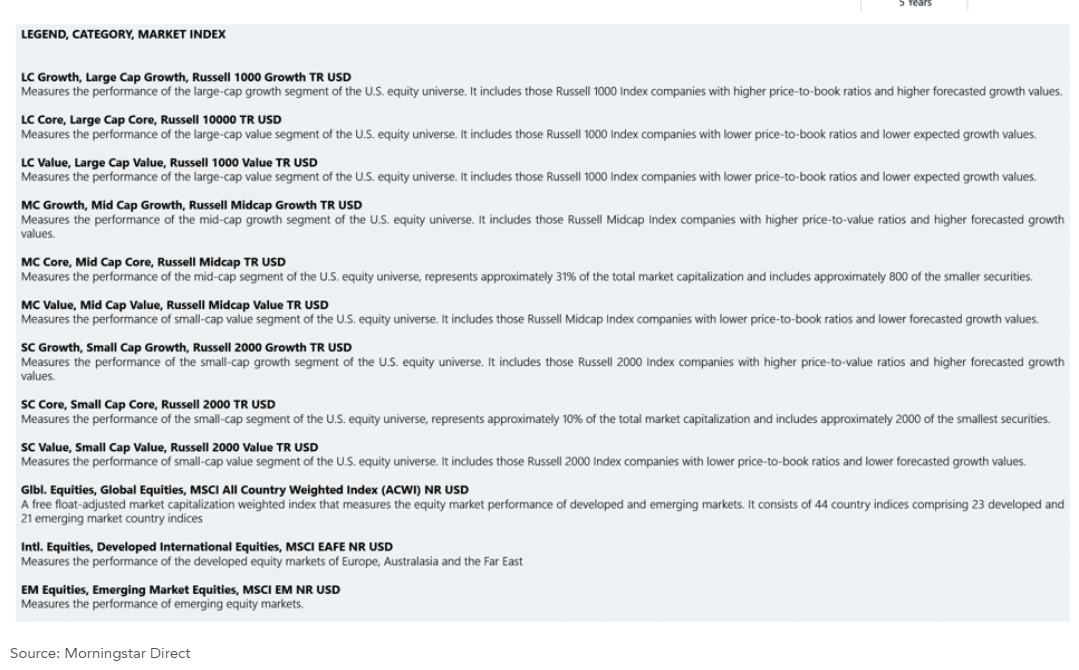
For 2024 and Q4 2024, Growth outperformed Core and Value, while U.S. Equities (represented by the Russell 3000) outperformed International Equities and Emerging Markets and (represented by MSCI EM and MSCI EAFE) on a Total Return basis (24.51% versus 7.50% versus 3.82%).

This outperformance was driven by the continued dominance of large tech companies, higher liquidity in the U.S. market, and faster earnings growth of U.S. companies compared to global counterparts. Notably, in Q4 2024, Mid Cap Growth (represented by Russell Mid Cap Growth) outperformed both Large Cap Growth and Small Cap Growth (8.14% versus 7.07% versus 1.70%).

S&P Equity Sectors

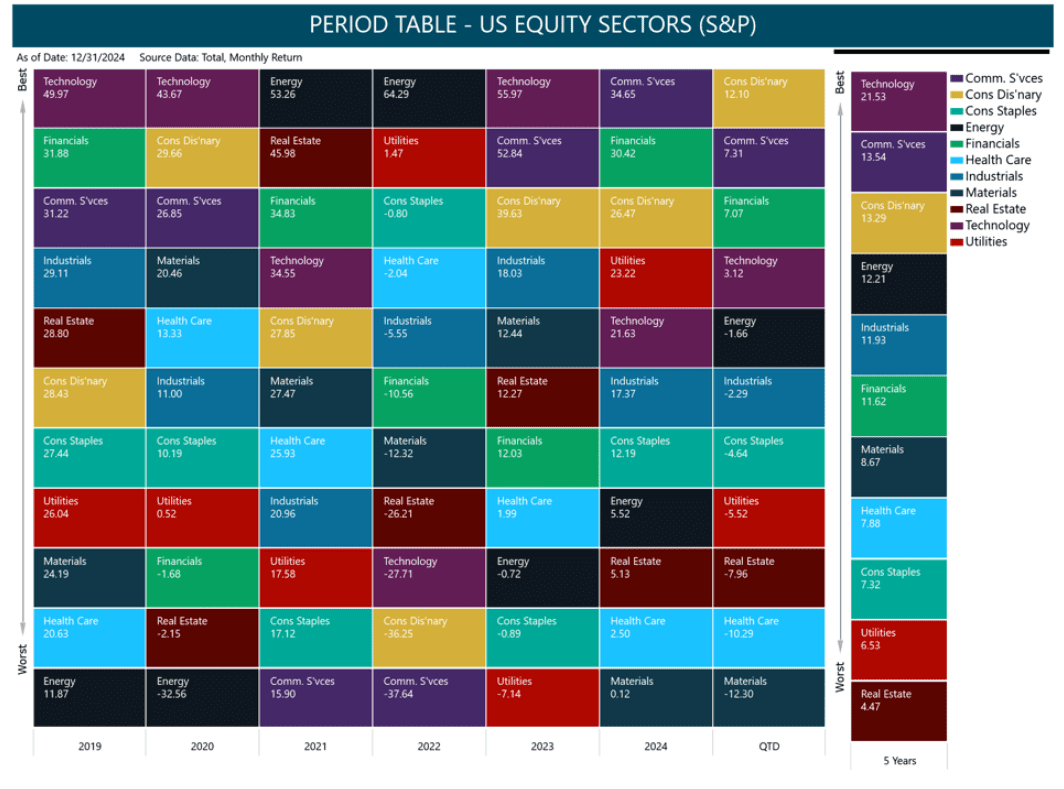
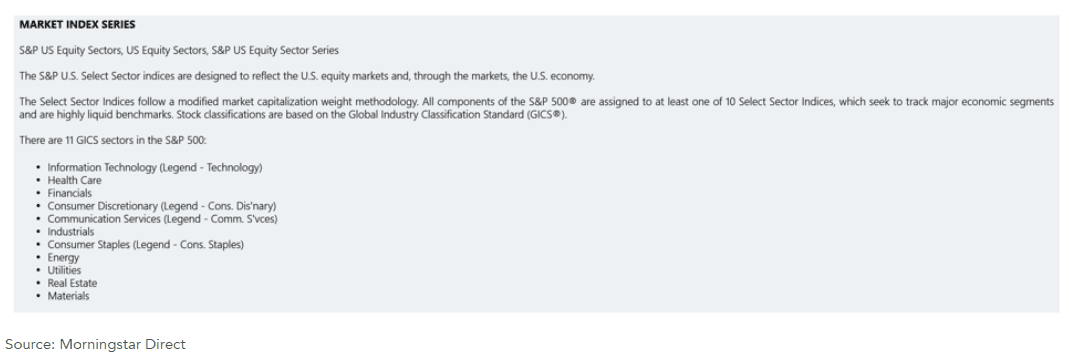
Communication Services, Financial Services, and Consumer Discretionary sectors emerged as the top performers for both the full year and the fourth quarter of 2024. The Communication Services sector delivered an impressive ~34% gain on a total return basis in 2024, significantly outpacing other sectors, primarily driven by strong investor interest in mega-cap tech companies and the advancements in artificial intelligence (AI) technologies. However, the Technology sector continues to outperform the other equity sectors on a trailing 5-year total return basis.

Fixed Income 

Yield Curve and Corporate Spreads

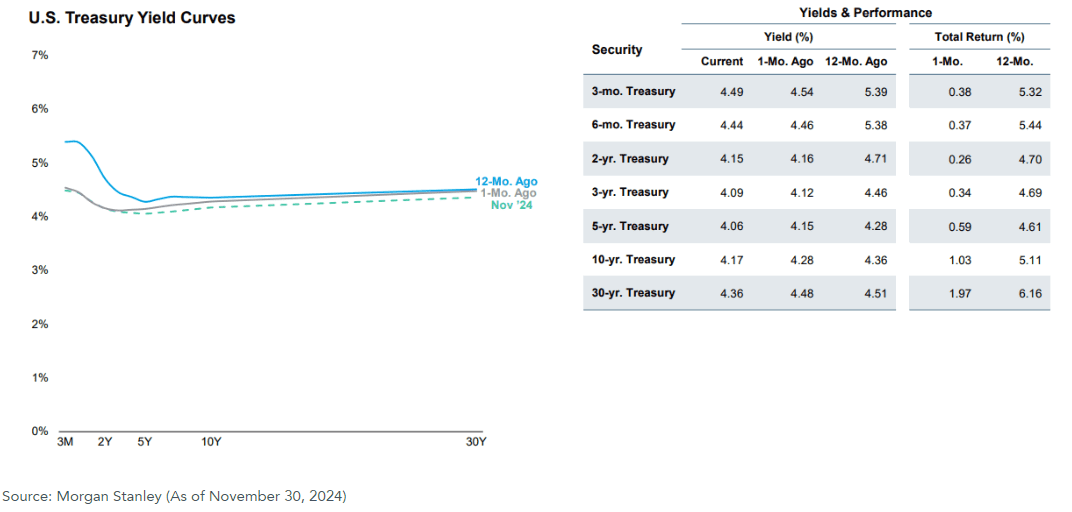
The U.S. Treasury yield curve was deeply inverted at the start of 2024 with short-term rates exceeding long-term rates. However, as the year progressed and towards the year end, the yield curve began to normalize slightly as long-term yields increased relative to short-term yields. This shift reflected market expectations for a more supportive monetary policy environment and reduced recession concerns.

Corporate credit spreads across all segments—including high yield bonds, investment-grade bonds, and leveraged loans—remained relatively stable throughout the fourth quarter of 2024. However, these spreads tightened significantly over the trailing 12-month period. This compression was due to improved risk appetite, expectations of continued economic growth, and anticipation of a supportive monetary policy environment.


Fixed Income Sectors

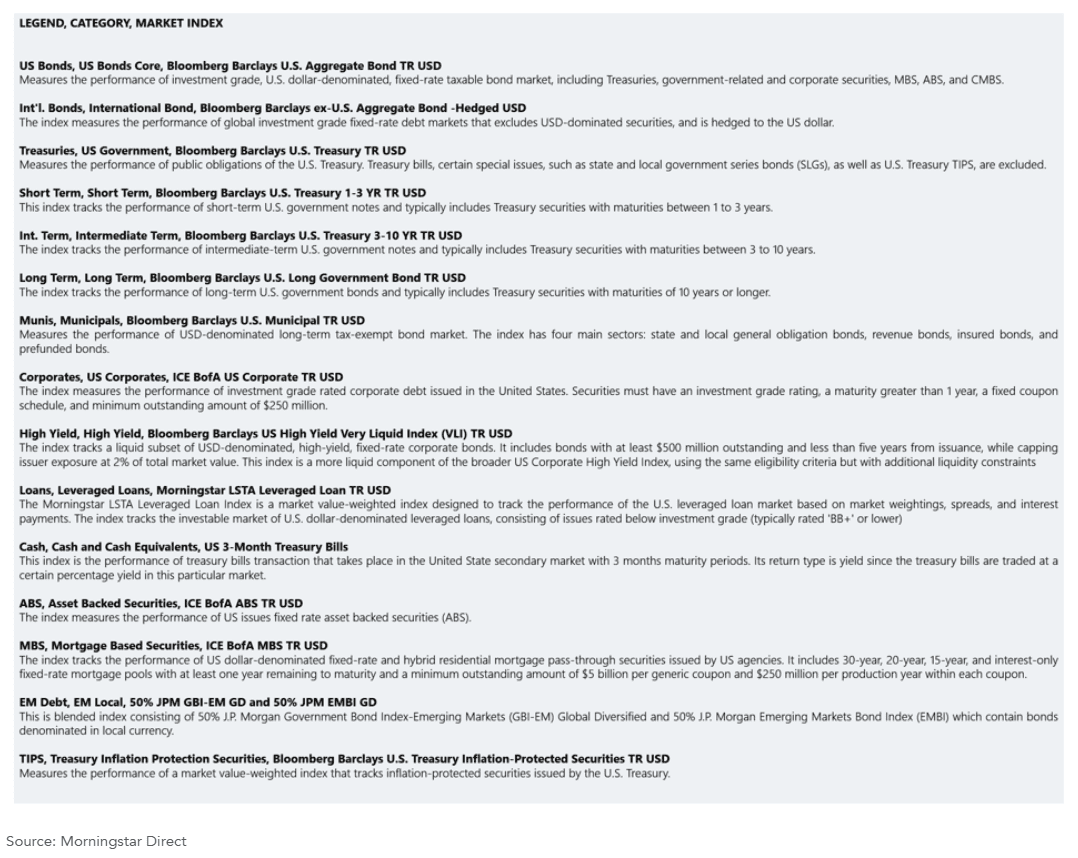
In 2024 and Q4 2024, leveraged loans, high-yield bonds, and asset-backed securities demonstrated strong performance, as reflected by their respective indices. The Morningstar Leveraged Loan LSTA TR index returned 8.95%, outpacing the Barclays US High Yield Very Liquid index at 7.66% and the ICE BofA ABS TR index at 5.93%. The strong performance of these riskier fixed-income assets can be attributed to factors such as expectations of Fed rate cuts, improving economic outlook, and investors’ search for yield in a changing rate environment. 


Week Ahead…

Next week, employment data will be a key focus for investors. Several crucial economic reports will be released, providing insights into the labor market. On Tuesday, the Job Openings and Labor Turnover Survey (JOLTS) report will be released, followed by the ADP Nonfarm Employment Change report on Wednesday and Initial Jobless Claims on Thursday. However, Friday will be the most data-rich day, with the release of December’s figures for Average Hourly Earnings, Bureau of Labor Statistics Nonfarm Payrolls, Unemployment Rate, U6 Unemployment, and Participation Rate. It’s worth noting that initial jobless claims ended last year on a positive note, beating estimates for three consecutive weeks. Additionally, last month saw a divergence between ADP data and Nonfarm Payrolls, markets will monitor whether this discrepancy will persist.

On Friday, the University of Michigan will release four key consumer sentiment reports. The first two focus on consumer inflation expectations over one and five years. One-year expectations have recently remained within a narrow range of 2.6% to 2.8%, while five-year expectations have fluctuated between 3.0% and 3.2%. Markets will closely watch these figures for any signs of a shift in inflation expectations. The remaining two reports measure consumer expectations and overall sentiment. As the backbone of the economy, consumer confidence is a crucial indicator of economic activity. A positive surprise in these reports would bode well for both current and future economic growth.

Early next week, markets will focus on the service sector with the release of the S&P Global and ISM Services PMIs on Monday and Tuesday. As the U.S. economy is heavily reliant on services, these surveys will provide crucial insights into the health of the broader economy. A strong reading will likely boost confidence and support asset prices, while a weaker reading could raise concerns about economic growth.

This content was developed by Cambridge from sources believed to be reliable. This content is provided for informational purposes only and should not be construed or acted upon as individualized investment advice. It should not be considered a recommendation or solicitation. Information is subject to change. Any forward-looking statements are based on assumptions, may not materialize, and are subject to revision without notice. The information in this material is not intended as tax or legal advice.

Investing involves risk. Depending on the different types of investments there may be varying degrees of risk. Socially responsible investing does not guarantee any amount of success. Clients and prospective clients should be prepared to bear investment loss including loss of original principal. Indices mentioned are unmanaged and cannot be invested into directly. Past performance is not a guarantee of future results.

The Dow Jones Industrial Average (DJIA) is a price-weighted index composed of 30 widely traded blue-chip U.S. common stocks. The S&P 500 is a market-cap weighted index composed of the common stocks of 500 leading companies in leading industries of the U.S. economy. The NASDAQ Composite Index is a market-value weighted index of all common stocks listed on the NASDAQ stock exchange.

Market Commentary | December 30th, 2024

Market Commentary | December 30th, 2024

Week in Review…

Major U.S. equity indices demonstrated mild gains for the week, primarily influenced by the Federal Reserve’s announcement of fewer anticipated interest rate cuts for 2025. This revelation heightened investor caution amidst persistent market volatility. For the week ending December 27, 2024:

  • The S&P 500 closed at +0.67%
  • The Dow Jones Industrial Average gained +0.35%
  • The tech-heavy Nasdaq rose +0.76%
  • The 10-Year Treasury yield concluded at 4.62%

Given the holiday on Wednesday and a half day on Tuesday, the markets were not as packed with earnings reports and economic data. However, there were several key reports released last week that should give the markets plenty to analyze. The week saw a mixed bag of news for several key sectors.

  • Real estate demand appears solid, though perhaps not as red-hot as initial forecasts suggested. November’s building permits data was revised downward, yet it still significantly outpaced original projections, indicating strong builder confidence. Month-over-month new home sales rebounded with a 5.9% increase, confirming that last month’s hurricane-disrupted figures were an outlier. The actual number of new home sales was a slight miss, but still in line with expectations. Overall, housing demand is in line with expectations, albeit slightly less amazing than originally stated. 
  • In contrast, manufacturing demand appears sluggish. Both headline and core durable goods orders fell short of expectations. Core Durable Goods Orders, a preferred metric excluding volatile aircraft orders, came in at -0.1% versus the projected 0.3%. This suggests manufacturers may be cautious about future demand and less inclined to make large purchases.
  • Consumers sent mixed signals this week. On Monday, the Conference Board’s consumer confidence report was significantly weaker than expected, raising concerns about economic activity. However, Friday’s data showed a sharp decline in crude oil inventories (4.237 million barrels versus a forecast of 0.700 million), suggesting continued strong demand for discretionary items like travel. This report capped a month where crude oil inventories exceeded expectations four out of five weeks. The market now faces the challenge of reconciling these conflicting surveys and hard data points.
  • Recent Treasury auctions underscore a trend of rising yields across maturities. Last week’s auctions of the 2-, 5-, and 7-year Notes saw yields increase notably compared to November: 2-year yields rose 6.1 basis points (bps), 5-year yields climbed 28.1 bps, and 7-year yields surged 34.9 bps. This pattern suggests a bear steepening of the yield curve, implying the market anticipates continued economic growth alongside inflation. However, given recent periods of high inflation, it is uncertain how much inflation the market will tolerate. The Federal Reserve will need to carefully navigate its communication to manage expectations.

Spotlight

The Santa Rally of 2024: A Year-end Market Phenomenon

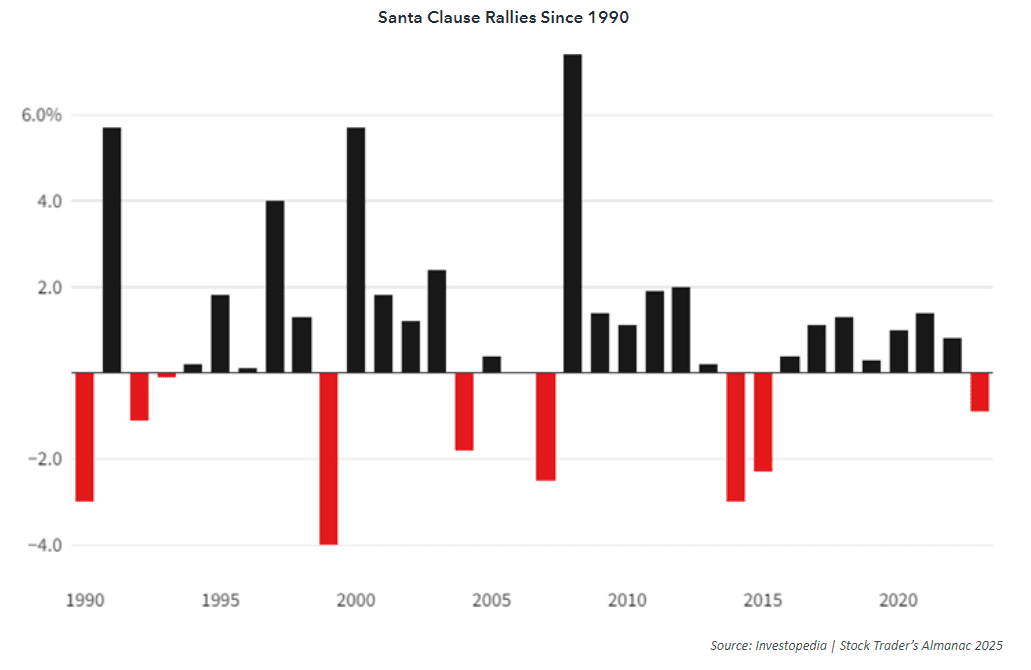
As the year draws to a close, investors and traders alike turn their attention to a well-known market phenomenon: the Santa Claus Rally. This term, coined by Yale Hirsch in 1972, refers to the tendency for stock markets to rise during the last five trading days of December and the first two trading days of January. The Santa Rally is often seen as a period of optimism and positive sentiment, and 2024 has been no exception.

Historical Context and Significance

Historically, the Santa Claus Rally has been a reliable, albeit modest, period of gains for the stock market. According to the Stock Trader’s Almanac, the S&P 500 has averaged a 1.3% gain during this seven-day trading window since 1969. This period is often characterized by lower trading volumes, as many institutional investors take time off, which can reduce resistance to upward price movements. Additionally, retail investors, buoyed by holiday bonuses and end-of-year optimism, often drive additional buying.


The 2024 Santa Rally

The 2024 Santa Rally kicked off on December 24 and will run through January 2. This year, the rally has been particularly anticipated due to a volatile December, where major indices experienced significant fluctuations. Recent trading sessions have shown positive movements, driven by a resurgence in tech stocks and overall market optimism.

Factors Which May Be Driving the Rally in 2024

Several factors contribute to the Santa Claus Rally. One key driver is investor sentiment. The holiday season often brings a wave of positive sentiment, as investors look forward to the new year with optimism. Additionally, tax considerations play a role, as investors may engage in tax-loss harvesting or repositioning their portfolios ahead of the new year.

Another factor is the lower trading volumes during the holiday season. With many institutional investors on vacation, there is less resistance to upward price movements, allowing for more significant gains. Retail investors, who are more active during this period, often contribute to the rally by making year-end purchases.

Looking Ahead

While the Santa Claus Rally is a well-documented phenomenon, it is not guaranteed. Broader economic events, geopolitical tensions, or bearish sentiment can easily disrupt the rally. However, the historical consistency of this trend makes it a point of interest for traders and investors.

As we move into the final days of 2024 and the first days of 2025, all eyes will be on the markets to see if the Santa Claus Rally will deliver its usual cheer. Whether you’re a seasoned investor or a market newcomer, understanding the dynamics of this period can provide valuable insights into market behavior and help inform your trading strategies.

Week Ahead…

The final week of 2024 and the start of 2025 are expected to have very few economic data releases. The key focus will be the ISM Manufacturing Purchasing Managers’ Index (PMI), which forecasters expect to remain below the 50 threshold, signaling continued contraction in manufacturing. This marks the ninth consecutive month of contraction, reflecting persistently soft demand. However, there are signs that the decline is moderating as companies shift their focus to planning for 2025.

Looking back on the year, against a backdrop of uncertainty, the U.S. economy has so far managed a remarkable soft landing. Despite initial concerns, the economy avoided a recession, with unemployment remaining low, albeit showing signs of weakening toward year-end, and inflation moderated significantly. The Federal Reserve’s approach to monetary policy played a crucial role. Contrary to market expectations of six rate cuts at the beginning of the year, the Fed delivered only three. Despite this restrained easing, the economy and markets adjusted well, with the S&P 500 surging nearly 30% year-to-date as of late December.

Market participants are approaching 2025 with a more tempered outlook. While optimism remains, for 2025 projections from major institutions like Morgan Stanley and Goldman Sachs suggest the S&P 500 could climb to 6500—still a solid gain from current levels, but reflective of moderated growth expectations.

In addition, the Federal Reserve’s latest economic projections also signal cautious optimism. Most officials foresee a 2% GDP growth rate, a slightly softer labor market, and fewer rate cuts than previously anticipated.

While future market performance cannot be predicted with certainty, the sentiment appears to favor a return to more measured growth in 2025.

As we bid farewell to a volatile 2024, we wish everyone a prosperous and fulfilling new year.

This content was developed by Cambridge from sources believed to be reliable. This content is provided for informational purposes only and should not be construed or acted upon as individualized investment advice. It should not be considered a recommendation or solicitation. Information is subject to change. Any forward-looking statements are based on assumptions, may not materialize, and are subject to revision without notice. The information in this material is not intended as tax or legal advice.

Investing involves risk. Depending on the different types of investments there may be varying degrees of risk. Socially responsible investing does not guarantee any amount of success. Clients and prospective clients should be prepared to bear investment loss including loss of original principal. Indices mentioned are unmanaged and cannot be invested into directly. Past performance is not a guarantee of future results.

The Dow Jones Industrial Average (DJIA) is a price-weighted index composed of 30 widely traded blue-chip U.S. common stocks. The S&P 500 is a market-cap weighted index composed of the common stocks of 500 leading companies in leading industries of the U.S. economy. The NASDAQ Composite Index is a market-value weighted index of all common stocks listed on the NASDAQ stock exchange.
Market Commentary | December 23rd, 2024

Market Commentary | December 23rd, 2024

Week in Review…

Major U.S. equity indices declined for the week, driven by the Federal Reserve’s announcement of fewer interest rate cuts in 2025 than previously anticipated. This news heightened investor caution amid ongoing market volatility.

For the week ending December 20, 2024:

  • The S&P 500 was down -1.99%
  • The Dow Jones Industrial Average was down -2.25%
  • The tech-heavy Nasdaq was down -2.25%
  • The 10-Year Treasury yield ended the week at 4.53%

The Federal Reserve’s recent monetary policy decision and a series of economic indicators have painted a complex picture of the U.S. economy as 2024 draws to a close. The central bank announced its third consecutive rate cut of the year, lowering the federal funds rate by 25 basis points to a range of 4.25% to 4.5%. This decision came despite higher-than-anticipated inflation data, with the Consumer Price Index (CPI) rising 0.3% in November. The market’s relatively calm reaction suggests that inflation concerns may be taking a backseat to other economic factors.

The labor market continues to show resilience, but subtle signs of weakening have emerged, becoming a more critical factor in shaping market expectations for future monetary policy decisions. Initial jobless claims decreased to 220,000 from 229,000, while continuing claims saw a slight decline from 1,890,000 to 1,874,000, indicating a still-robust job market with some signs of moderation.

Economic indicators released in the lead-up to the Fed meeting provided a mixed outlook across various sectors. The Purchasing Managers’ Index (PMI) data revealed a slight contraction in manufacturing activity with a reading of 48.3. The housing market showed divergent trends, with building permits rising by 6.1% while housing starts fell by 1.8%. Third-quarter gross domestic product (GDP) figures were revised upward to a 3.1% annual growth rate, reflecting stronger consumer spending and exports. However, the Philadelphia Fed Index’s significant decline to -16.4 pointed to contraction in regional manufacturing activity. On a positive note, existing home sales reached a six-month high, increasing 4.8% from October.

The Personal Consumption Expenditures (PCE) data, the Federal Reserve’s preferred inflation measure, showed a 2.4% annual increase, slightly below expectations. Separately, the Conference Board Leading Economic Index® (LEI) for the U.S. increased by 0.3% in November 2024, marking its first rise since February 2022. This positive sign for future economic activity was supported by improvements in building permits, equity markets, and manufacturing hours worked, as well as fewer initial unemployment claims.

The aforementioned array of economic indicators will play a crucial role in shaping market perspectives on economic growth, inflation trends, and the Federal Reserve’s policy trajectory as we move into 2025.

The Fed’s updated projections now anticipate fewer rate cuts in the coming year, with only two reductions totaling 50 basis points expected in 2025, down from the full percentage point of cuts projected in the previous quarter.

Spotlight

The Unexpected Winner in Commercial Real Estate – Retail 

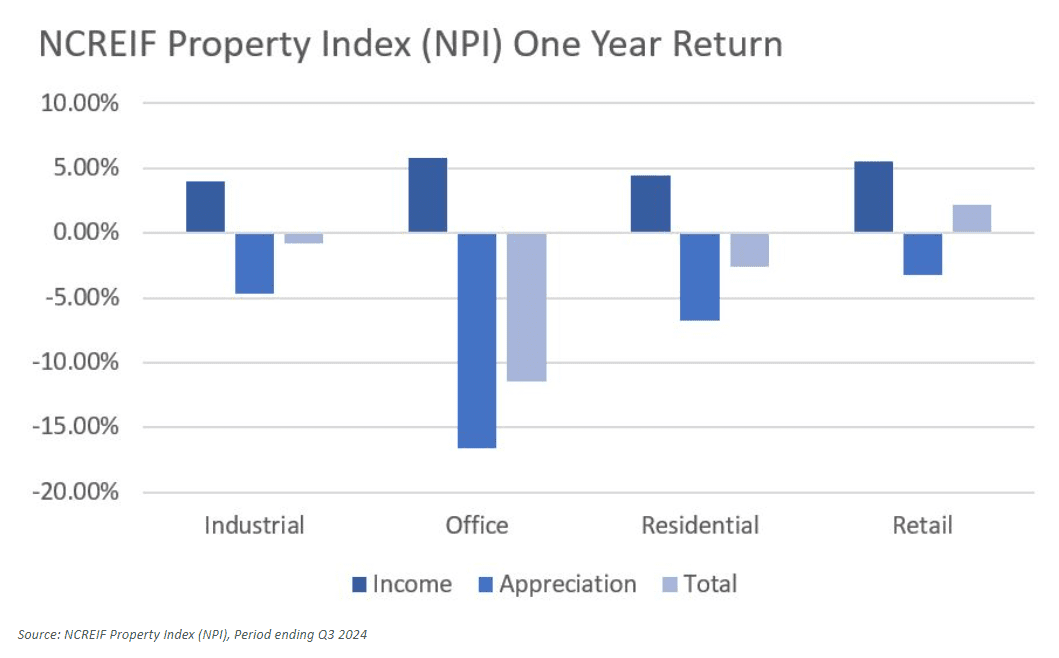
The Federal Reserve implemented a series of 11 interest rate hikes at an unprecedented pace between March 2022 and mid-2024 to combat inflation, resulting in a cumulative increase of 525 basis points in the Fed Funds rate. This aggressive monetary tightening significantly impacted Commercial Real Estate (CRE) performance. However, contrary to expectations, the retail sector emerged as a surprising bright spot for investors. According to the NCREIF Property Index (NPI), the benchmark for private institutional CRE performance, retail was the only core sector to deliver positive returns over the year leading up to the third quarter of 2024.


Before examining the reasons behind retail outperformance, it’s important to note that the NCREIF Property Index (NPI) typically responds with a lag due to its reliance on appraisals. Additionally, retail space performance can vary significantly across property subtypes such as malls, strip centers, and street-front locations.

The perception and demand for brick-and-mortar retail has markedly improved since the early 2010s. During that period, the retail sector faced significant challenges:

  • High-profile bankruptcies in the aftermath of the Global Financial Crisis (GFC)
  • Fears of e-commerce dominating the retail industry
  • An oversupply of retail space

These factors contributed to substantial negative investor sentiment towards retail properties, leading to the widespread use of the term “retail apocalypse” to describe the market environment. However, recent years have seen a revitalization of physical stores, driven by:

  • The COVID-19 pandemic
  • The rise of hybrid shopping methods, such as “buy online, pickup in-store” (BOPIS)

Physical stores have evolved to become central hubs for goods distribution and revenue diversification for digital brands, reaffirming the demand for brick-and-mortar retail.

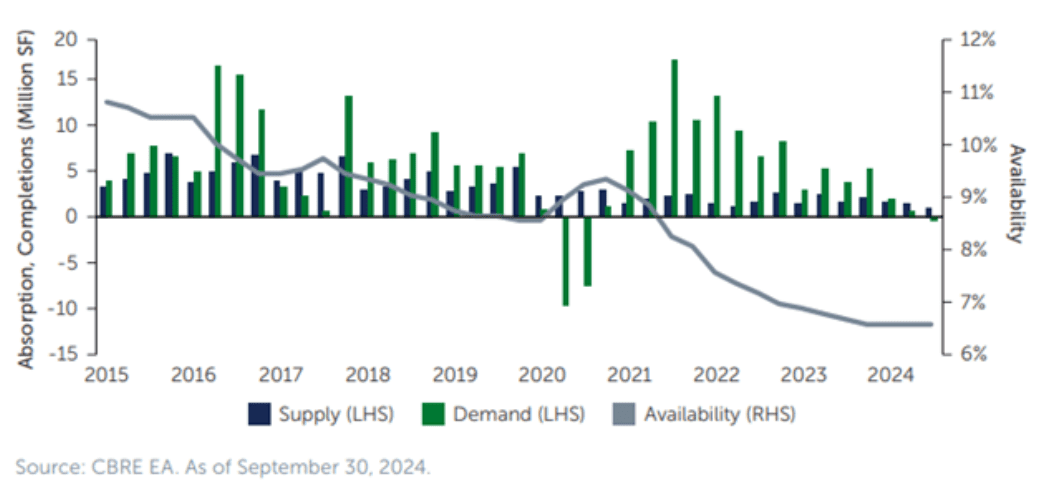
On the supply side, the fear of a “retail apocalypse” led to a significant decrease in retail space development after the GFC. According to Greenstreet:

  • From 2001 to 2008, new supply averaged approximately 2.5% of the total stock annually
  • In the following decade, new supply dropped to only about 0.5% of the existing stock per year

This lack of new supply, combined with strong retailer demand, has created a favorable market environment. As a result:

  • Occupancy rates for retail properties are now at their highest levels ever recorded
  • A backlog of leases is poised to drive strong Net Operating Income (NOI) growth
  • Retailers are quickly re-tenanting spaces from bankrupt tenants, minimizing disruption for landlords

These factors collectively contribute to the current outperformance of the retail sector in the commercial real estate market.

Exhibit: Retail space is at the tightest level ever with minimal supply over the past decade

Retailers previously focused on mall-based models are now closing their traditional stores to explore expansion opportunities in newer open-air retail spaces. Given the strong economic climate and robust consumer spending, neighborhoods, community, and strip centers are likely to experience continued high demand. In contrast, traditional malls are expected to face ongoing performance challenges and softening demand.

Week Ahead…

Next week marks the arrival of the holiday season, with Christmas Eve and Christmas Day occurring in the middle of the week. As a result, financial markets are likely to take a pause. While the bulk of earnings reports are coming to an end, investors should still pay close attention to several important economic indicators, especially those related to consumer demand.

On Tuesday, December 24, key economic data will be released that will shed light on consumer spending trends. The Durable Goods Orders report, which tracks changes in orders for long-lasting goods, will act as a vital gauge of consumer confidence and economic vitality. A strong report typically reflects robust consumer sentiment and a healthy economy.

Additionally, revised building permit data will be published on the same day. Market participants will be keen to see if the initial upward revision holds steady. New home sales figures will also be closely watched, as they are essential indicators of consumer demand and economic activity. This report is particularly noteworthy since it is expected to be less influenced by earlier hurricanes, thereby providing a clearer picture of consumer behavior. Moreover, with stable 30-year mortgage rates, fluctuations in interest rates are unlikely to significantly impact housing demand.

On Monday, December 23, the Conference Board will unveil its Consumer Confidence report. This survey-based data on consumer sentiment, when analyzed alongside hard data on durable goods and housing sales, can provide a thorough understanding of the current consumer landscape. The state of consumer spending will be an important metric as we transition into the new year, offering insights into potential economic trends for 2025.

This content was developed by Cambridge from sources believed to be reliable. This content is provided for informational purposes only and should not be construed or acted upon as individualized investment advice. It should not be considered a recommendation or solicitation. Information is subject to change. Any forward-looking statements are based on assumptions, may not materialize, and are subject to revision without notice. The information in this material is not intended as tax or legal advice.

Investing involves risk. Depending on the different types of investments there may be varying degrees of risk. Socially responsible investing does not guarantee any amount of success. Clients and prospective clients should be prepared to bear investment loss including loss of original principal. Indices mentioned are unmanaged and cannot be invested into directly. Past performance is not a guarantee of future results.

The Dow Jones Industrial Average (DJIA) is a price-weighted index composed of 30 widely traded blue-chip U.S. common stocks. The S&P 500 is a market-cap weighted index composed of the common stocks of 500 leading companies in leading industries of the U.S. economy. The NASDAQ Composite Index is a market-value weighted index of all common stocks listed on the NASDAQ stock exchange.